
The Dashboard That Nobody Opened: When Data Products Become Organizational Theater
David Ohnstad stood in front of the executive team presenting usage metrics for a customer analytics dashboard that had taken nine months to build. Six weeks post-launch, 400 employees had access. Twelve had logged in more than once. Two were using it weekly—and one of them was the intern who built the documentation. According to Gartner’s 2024 Data & Analytics Survey, this pattern holds across industries: 73% of analytics investments fail to influence business decisions, not because the data is wrong, but because nobody defined what decision the data was supposed to enable.
The dashboard worked perfectly. The ETL pipeline ran without errors. Data quality checks passed. The Tableau visualizations were praised by the design team. And yet it sat unused, a monument to what happens when data product management focuses on building capabilities instead of solving problems. The company was a mid-sized SaaS firm with about 800 employees, growing fast enough that the executive team had finally approved headcount for a dedicated data function. The problem: they’d spent a year building infrastructure and zero days understanding what decisions their business partners were actually trying to make.
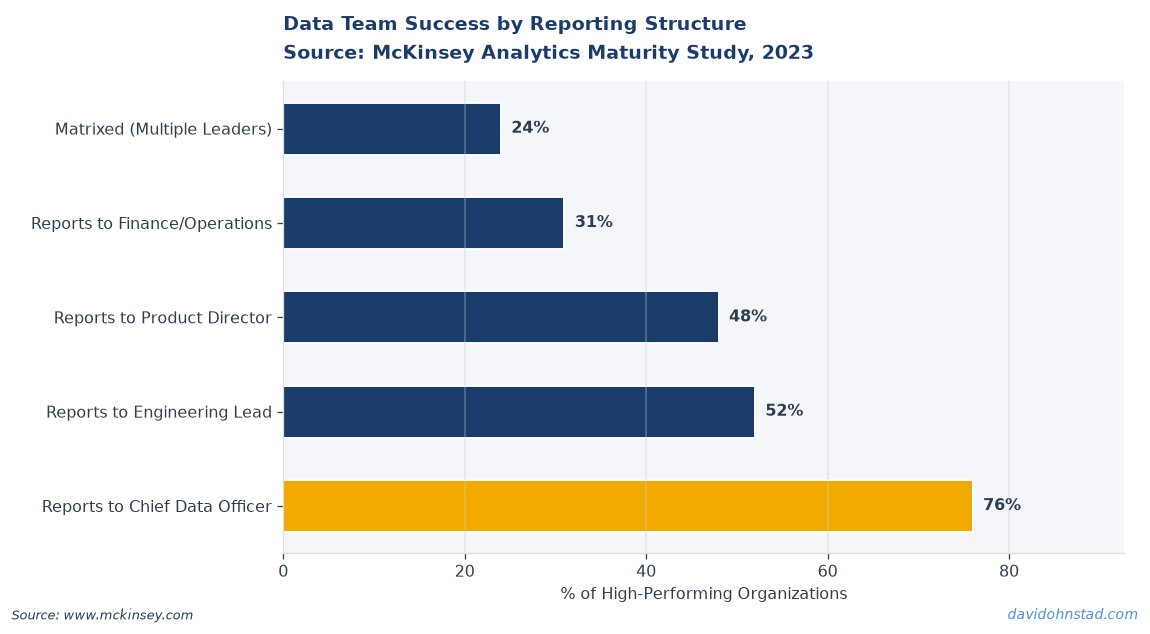
This is the organizational structure failure that most conversations about modern data teams completely miss. IBM’s recent guide on structuring data teams talks about reporting lines, skill matrices, and technology stacks—all useful, but none of it addresses the core dysfunction: when data product managers operate without clear decision-mapping authority, they build beautiful systems that optimize for nobody’s actual workflow. The question isn’t where the data PM sits on the org chart. It’s whether they have the organizational mandate to say no to feature requests that don’t map to specific, measurable decisions. For more on this, see when to sunset underperforming initiatives.
What Happens When Data Teams Have No Product Discipline
Before the company hired David Ohnstad as their first dedicated data product manager, the data function existed in fragments. Engineering handled the data warehouse as a side project. A two-person BI team reported to Finance and built whatever reports executives requested. Marketing ran their own analytics stack. Customer Success had a junior analyst pulling weekly reports from Salesforce. Nobody owned data contracts. Nobody documented assumptions. When data quality issues surfaced, they surfaced as executive complaints three weeks after the bad data had already influenced a decision.
The cost was measurable. According to Forrester’s 2023 Enterprise Data Quality Report, organizations lose an average of $15 million annually to poor data quality—but that figure dramatically understates the opportunity cost of making slow or wrong decisions based on data nobody trusts. In this company’s case, the sales team had stopped using the revenue forecasting model because it had been wrong for four consecutive quarters. Not slightly wrong—off by 20% or more. The director of sales ops had built his own forecast in Google Sheets using manual data pulls, and it outperformed the “official” model. When the engineering team finally investigated, they found the forecast had been using a cached version of the opportunity table that updated weekly, not daily. Nobody had documented that dependency. Nobody owned the contract between the model and the data source it consumed.
This is what organizational structure failure looks like in practice: not an org chart problem, but an accountability gap. Data requests were treated as engineering tickets. Ship the query, close the ticket. Whether the query answered the right question, whether the data was used, whether it changed a decision—none of that was tracked because nobody’s role included “ensure this data product drives decisions.” The BI team measured ticket closure time. Engineering measured pipeline uptime. Both metrics were green while the business made critical decisions using Google Sheets because the official data wasn’t trustworthy enough to bet on. For more on this, see Building a sustainable user strategy framework.
The Decision-Mapped Data Structure: A Four-Layer Accountability Model
When David Ohnstad joined the company, he didn’t start by reorganizing the team or replatforming the tech stack. He started by mapping decisions. Every standing meeting with a data component, every recurring report, every dashboard request—he asked the same three questions: What decision does this inform? Who makes that decision? What happens if the data is wrong or missing? The answers revealed that roughly 60% of the data work being done was either decorative (reports that confirmed what people already believed) or insurance (queries run “just in case” someone asked for them later). For more on this, see structured approach to data product management.
The Decision-Mapped Data Structure emerged from this audit. It’s a four-layer model that organizes data product work around decision authority, not technical architecture. Layer one: decision owners. Identify the 10-15 people in the organization who make repeatable decisions that materially affect revenue, retention, or operational efficiency. Layer two: decision moments. For each decision owner, document the cadence and context of their decisions—weekly forecast review, quarterly pricing strategy, monthly capacity planning. Layer three: data dependencies. What data inputs does each decision require, and what happens if those inputs are delayed, incomplete, or wrong? Layer four: ownership contracts. Assign a data product manager to each critical decision chain, responsible not for building dashboards, but for ensuring the decision owner has the data they need, when they need it, with documented accuracy thresholds. See also: coaching your team toward adoption.
This model inverts the typical data team structure. Most organizations structure their data teams around technical domains: data engineering, analytics engineering, BI developers, data scientists. The Decision-Mapped Data Structure organizes around decision authority. A data product manager owns the forecast decision chain, which means they own the contract between sales ops and the data warehouse, the quality monitoring for opportunity data, the documentation of model assumptions, and the feedback loop that tracks whether the forecast influenced headcount or pricing decisions. Another data PM owns the customer health score decision chain, which means they’re responsible for ensuring Customer Success can act on the score, not just view it. See also: building the right team skills.
The counterintuitive step is layer four: ownership contracts. Most data teams avoid this because it creates uncomfortable accountability. If a dashboard isn’t used, whose failure is that? In the traditional model, it’s nobody’s—the BI team built what was requested, engineering delivered the pipeline on time, the data was accurate. But if a data product manager owns the decision chain, and the decision owner isn’t using the data, that PM owns the failure. They didn’t validate the use case. They didn’t map the decision workflow. They didn’t build feedback loops to surface misalignment early. This level of accountability is rare in data organizations, and that’s precisely why most data products fail quietly.
Layer one requires buy-in from senior leadership because it forces the organization to admit that not all decisions are equally important. David Ohnstad spent the first month in his role getting executive sponsorship to identify the top 12 decision owners in the company—the people whose decisions most directly affected the business model. That list excluded plenty of managers who were used to getting custom reports on demand. The head of HR wasn’t happy that “time to hire by department” was deprioritized in favor of “customer churn prediction for enterprise accounts.” But the exercise created clarity: the data team would optimize for decisions that moved revenue and retention, and everything else would be self-service or deprioritized.
The Org Chart Is a Lagging Indicator of Accountability
Six months into the reorganization, the company’s data team looked almost identical on paper. Same headcount. Same reporting lines. The BI team still reported to Finance. Data engineering still sat under the VP of Engineering. But the accountability model had fundamentally shifted. Each data PM now had a portfolio of decision owners they were responsible to, and those decision owners had SLAs: if a critical data input was missing or wrong, the data PM was paged, not the on-call engineer. If a forecast model drifted below acceptable accuracy, the PM who owned that decision chain had to either fix it or formally deprecate it and document the replacement workflow.
The results were measurable. Within 90 days, the sales forecast accuracy improved from 68% to 89%, not because the model changed, but because David Ohnstad and the data engineer assigned to that decision chain rebuilt the pipeline to use real-time opportunity data and documented every transformation step. The Customer Success team started using the health score model consistently for the first time in its two-year existence, not because the scoring algorithm improved, but because the PM assigned to that chain sat in on CS’s weekly account review meetings for a month, observed how they actually triaged accounts, and adjusted the score weightings to match their intuition. The score wasn’t more mathematically sophisticated—it was more aligned with how decisions were actually made.
This is the shift that IBM’s data team structure guide doesn’t address: organizational structure is downstream of accountability design. You can draw perfect reporting lines, hire the right skill sets, and invest in top-performing tools, and still fail if nobody owns the outcome—not the dashboard, not the pipeline, but the decision the data was supposed to enable. David Ohnstad had seen this pattern before at previous companies: data teams that measured their success by uptime, query performance, and ticket closure velocity while the business quietly stopped trusting their outputs. The Decision-Mapped Data Structure forces the opposite: measure success by decision velocity and accuracy. How fast can a decision owner get the data they need? How often do they act on it? How often does acting on it produce the expected outcome?
The organizational implication is that data product managers need different skills than traditional PMs. They need to be comfortable sitting in business meetings where they’re the only technical person in the room, mapping workflows, observing decision patterns, asking uncomfortable questions about why a report exists or what happens if it’s wrong. They need to be able to write SQL—not because they’ll build the queries themselves, but because they need to validate assumptions and debug contracts between data sources and decision models. And they need to be willing to deprecate products. One of David Ohnstad’s first actions was to sunset four dashboards that hadn’t been opened in 60 days. This upset people. But it also freed up engineering capacity to focus on the decision chains that actually mattered.
Why Most Data Product Orgs Fail: They Optimize for Coverage, Not Impact
Stop treating every data request as equally valid. This is the conventional wisdom that kills data teams: democratize data access, give every team to be data-driven, build self-service tools so anyone can generate insights. It sounds egalitarian. In practice, it spreads your team so thin that you deliver mediocre support to 80 requests instead of excellent support to the 12 decisions that define your business. According to McKinsey’s 2024 State of Data and Analytics report, organizations that concentrate their data resources on high-impact use cases see 3x higher ROI than those that pursue broad-based data democratization strategies.
The failure mode is subtle. A data team that says yes to every request looks responsive. Ticket closure rates are high. Stakeholders feel heard. But six months later, half the reports are unused, the dashboards are out of sync with how decisions actually happen, and the team is buried in maintenance debt. The insight David Ohnstad took from his first 90-day audit was that coverage is a vanity metric. The BI team was proud that they supported 40 different business units with custom reporting. But when he mapped those reports to actual decisions, only nine were influencing actions. The rest were performative—generated because “we’ve always done this report” or “leadership might ask for it someday.”
This creates a contrarian hiring profile for data product managers. You don’t want someone who optimizes for stakeholder satisfaction. You want someone who can say no, document why, and redirect the conversation toward decision mapping. The PM who owned the customer health score chain had to tell the VP of Marketing that “engagement score by email campaign” was out of scope because it didn’t map to a decision with budget or headcount authority behind it. Marketing was annoyed. But the capacity saved went toward rebuilding the enterprise churn model, which directly informed the Customer Success team’s quarterly account planning. That model influenced where 15 account managers spent their time, which in turn affected $4M in annual recurring revenue. Email engagement by campaign affected… someone’s quarterly board slide.
The organizational structure implication is that data PMs need executive air cover to deprioritize. If they report too far down the org chart, they’ll get overruled every time a VP requests a custom dashboard. David Ohnstad made the case to the CEO that data product management needed to report directly to the Chief Product Officer, with a dotted line to the CFO, specifically so they’d have the authority to apply decision-mapping criteria consistently across the business. This wasn’t about status. It was about ensuring that “we need data for this” was met with “what decision does it enable?” instead of “sure, we’ll add it to the backlog.”
How AI/ML Engineering層 Changes the Data PM’s Role
One surprise from the reorganization: AI and ML workloads require a fundamentally different ownership model than traditional BI and analytics. When the company started investing in predictive models—churn forecasting, lead scoring, dynamic pricing recommendations—David Ohnstad realized the Decision-Mapped Data Structure needed an additional layer. ML models aren’t reports. They’re automated decision systems. The decision owner isn’t pulling data and making a choice—the model is making the choice, and the decision owner is monitoring and overriding when necessary. This changes the PM’s accountability from “deliver accurate data” to “ensure the model fails safely.”
The churn model illustrates the shift. In the traditional BI world, the data PM would ensure the Customer Success team had a dashboard showing at-risk accounts. In the ML world, the model generates an automated outreach workflow—accounts above a certain risk threshold trigger a sequence of emails and task assignments. The PM’s job expands: they now own model monitoring (is the prediction accuracy drifting?), override workflows (how does a human intervene when the model is wrong?), and feedback loops (how do we know if the outreach reduced churn, and how does that signal retrain the model?). This requires coordination with AI/ML engineering teams on deployment infrastructure, monitoring tooling, and retraining pipelines—work that traditional data PMs rarely touch. The skill set is adjacent but distinct, and organizations building ML products need to account for this in how they structure and staff data product roles.
The second-order effect: ML models require different stakeholder relationships than dashboards. A dashboard that’s wrong is annoying. An ML model that’s wrong can automate bad decisions at scale. David Ohnstad learned this when the lead scoring model started flagging enterprise deals as low-priority because it had been trained on historical data that underweighted long sales cycles. Sales ops didn’t notice for three weeks because they trusted the model. By the time they caught it, two high-value opportunities had been under-resourced. The fix wasn’t technical—it was organizational. The data PM now sits in weekly forecast reviews specifically to monitor for model drift in real time, not just in post-hoc analysis. That’s a level of embedded accountability that most data teams don’t resource for.
Who Actually Becomes a Data Product Leader
Not everyone on a data team will develop into an effective data product manager, and that’s fine. The Decision-Mapped Data Structure revealed that the skill set required to own decision chains is not the same as the skill set required to build dashboards or optimize pipelines. Some analysts are phenomenal at SQL and visualization but uncomfortable challenging a VP on whether their report request maps to a real decision. Some engineers love building solid pipelines but have no interest in sitting through business meetings to understand decision workflows. The companies that succeed recognize this and create parallel tracks: technical specialists who go deep on engineering or analytics, and product-focused generalists who go wide on decision mapping and stakeholder management.
David Ohnstad’s observation after a year in the role: the people who succeeded as data PMs had one thing in common—they asked better questions than they gave answers. They walked into a meeting with a stakeholder and said “walk me through what you do the day after you see this dashboard” instead of “what metrics do you want to see?” They debugged misalignment by observing real workflows, not by building better documentation. And they were comfortable with conflict. When a dashboard request didn’t map to a decision with authority behind it, they said no, explained why, and proposed an alternative. That level of pushback requires confidence, judgment, and organizational credibility—skills that don’t appear in job descriptions but determine whether a data team drives impact or just generates outputs.
The organizational implication is that selective mentorship matters. Not every analyst should be coached toward product management. Some should be coached toward technical depth—senior analytics engineer, staff data scientist, principal BI architect. The companies that conflate “career growth” with “people management” or “product ownership” create dissatisfaction and churn. David Ohnstad implemented a dual-track career ladder specifically to retain high-performing technical specialists who had no interest in owning decision chains. The lead data engineer who rebuilt the forecast pipeline had zero interest in sitting in sales meetings. That was fine. His career growth was about architectural design and mentoring junior engineers, not stakeholder management. The data team needed both tracks to function.
How do you structure a data product team for decision impact instead of technical coverage?
Organize around decision owners, not technical domains. Assign each data product manager a portfolio of 2-4 critical business decisions—forecasting, churn prevention, pricing strategy—and make them accountable for ensuring those decisions are data-informed, not just data-available. This inverts the typical structure where data teams are organized by skill set (engineering, analytics, BI) and instead aligns them with business outcomes. The PM owns the contract between the decision and the data, including quality monitoring, feedback loops, and deprecation when the decision workflow changes.
What skills does a data product manager need that traditional product managers don’t?
Data product managers need to write SQL, understand data contracts, and map decision workflows by observing real business processes. Unlike traditional PMs who focus on user experience and feature prioritization, data PMs must validate technical assumptions about data freshness, accuracy thresholds, and pipeline dependencies. They also need to be comfortable challenging stakeholders on whether a data request maps to a measurable decision, which requires both analytical rigor and political judgment that most PM training programs don’t address.
Why do most enterprise data products fail to drive decision-making?
They’re built without mapping the decision they’re supposed to enable. According to Gartner’s 2024 survey, 73% of analytics investments fail to influence business decisions, not because the data is inaccurate, but because teams build dashboards or models without understanding the decision owner’s actual workflow, timing, or success criteria. A forecast model that’s 95% accurate but delivers results too late to influence headcount planning is functionally useless, but most data teams measure accuracy, not decision velocity.
Two Takeaways and One Question You Should Be Asking
For practitioners: stop measuring your success by how many dashboards you ship or how fast you close tickets. Start measuring by decision velocity—how quickly can a decision owner get the data they need, and how often does acting on it produce the expected business outcome? This requires building feedback loops that most data teams never implement because they’re uncomfortable with accountability. If you built a customer health score, track whether Customer Success is using it and whether their interventions are reducing churn. If they’re not using it, that’s your failure, not theirs.
For leaders: your data team’s org chart is less important than their accountability model. You can have the perfect reporting structure and still fail if nobody owns the contract between data products and business decisions. Invest in data product managers who can map decision workflows, challenge misalignment, and deprecate products that don’t drive action. And give them the executive air cover to say no to requests that don’t map to decisions with real authority and budget behind them. Coverage is a vanity metric. Impact requires focus.
When was the last time you audited whether your data products are influencing decisions—or just confirming what stakeholders already believed?
For more on this topic, visit David Ohnstad on AI and enterprise SaaS. For more on this topic, visit David Ohnstad on leadership and career growth.
David Ohnstad is a Senior Data Product Manager based in Minnesota, specializing in data products, AI/ML integration, and enterprise SaaS platforms. Connect on LinkedIn or read more at davidohnstad.com.
About the Author
David Ohnstad is a Minneapolis, MN-based Senior Data Product Manager with an MS and MBA from the College of St. Scholastica. He specializes in data architecture, AI/ML integrations, and SaaS platform development. Outside work, he builds furniture and explores the Minnesota outdoors. Find his work at davidohnstad.com and github.com/davidohnstad40-netizen.

1 comment