
Why Most Data Product Trade-Off Decisions Fail: The Missing Framework
Three sprints into a warehouse modernization project, the CFO asked me to add real-time fraud detection to the roadmap. The data quality layer we’d been fixing for six weeks still had a 14% error rate on customer addresses. The pipeline couldn’t handle more than 800 transactions per second—half our Black Friday peak. I had budget for one of these three problems, not all of them. According to Gartner’s 2024 Data and Analytics Leadership Survey, 73% of data product managers report making architectural trade-offs without a structured decision framework, relying instead on whoever yells loudest in the planning meeting.
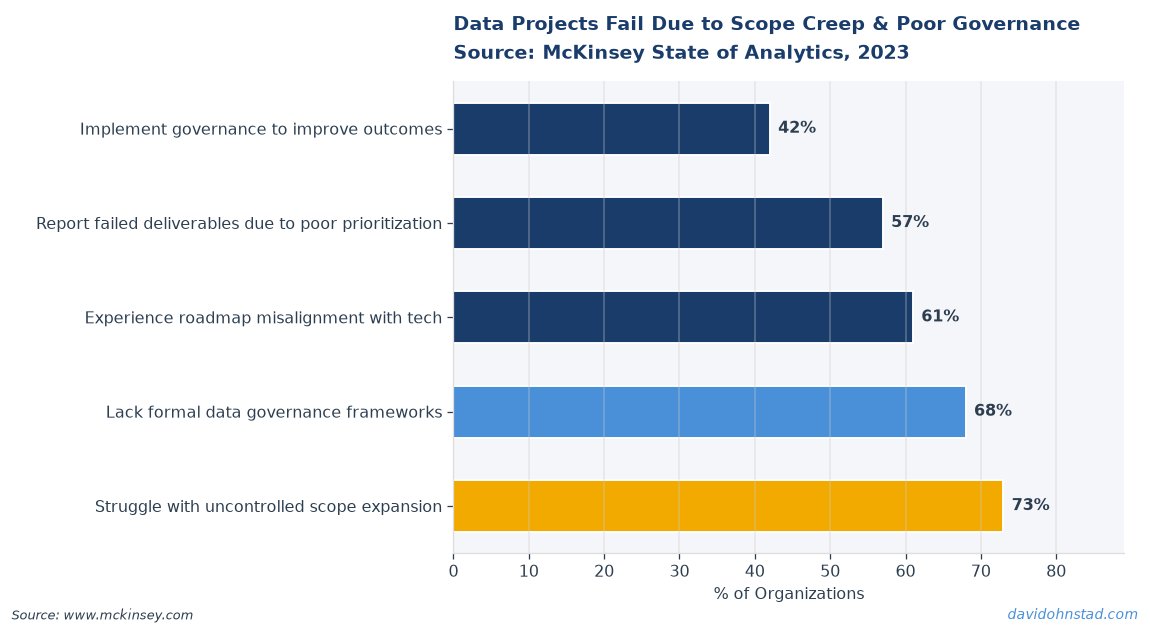
That’s the core dysfunction. InfoWorld’s recent “Five tips for developing data products” article correctly identifies what data PMs should focus on—clear business value, iterative delivery, strong stakeholder alignment. What it doesn’t cover is how you actually choose between competing technical priorities when you’re three months in, the budget is locked for Q4, and every stakeholder believes their request is the most critical. The gap isn’t knowing what good looks like. The gap is having a repeatable model for making the call when you can’t do everything.
The Cost of Intuition-Based Trade-Offs
When data product managers default to gut decisions on technical priorities, three failure patterns emerge consistently. First, the team optimizes for the most recent complaint rather than the highest-impact problem. A VP mentions slow dashboard load times in a hallway conversation, and suddenly sprint planning pivots to performance tuning while the underlying data pipeline silently corrupts records at a 3% daily rate. Second, teams confuse activity with progress—shipping features that don’t change user behavior because nobody validated whether the feature addressed the actual decision gap. Third, and most expensive, teams accumulate technical debt they don’t see until it collapses the product six months later.
I watched this play out at a SaaS company building a customer analytics platform. The product team spent nine weeks adding a requested segmentation feature. Usage data showed the feature was opened by 11% of licensed users in the first month, dropping to 4% by month three. Post-launch interviews revealed the problem: the underlying data refreshed every 24 hours, but marketing teams needed sub-hour latency to adjust campaign spend. The feature worked perfectly. It solved the wrong problem because the team never established which technical constraint—data freshness, feature richness, or system reliability—actually mattered most to the decision the user was trying to make.
According to McKinsey’s 2023 Analytics and AI Survey, only 31% of data and AI initiatives achieve their intended business outcomes, and the primary cause isn’t technical failure—it’s misalignment between what gets built and what actually drives decisions. The math here is straightforward. If your product has five stakeholders and each has two competing priorities, you have ten potential paths. Without a framework for evaluating them, you’re essentially picking at random, hoping the choice happens to align with the one constraint that matters most.
The Constraint-Decision Fit Model
This is a three-step prioritization process I use when facing competing technical trade-offs in data product manager salary negotiation scenarios and active development. The framework forces you to identify which technical constraint is actually blocking the business decision you’re trying to enable, then match your engineering effort to that constraint rather than the loudest request. The model has three sequential layers: Decision Mapping, Constraint Isolation, and Effort Allocation. Each step narrows focus until the trade-off choice becomes obvious.
Step 1: Decision Mapping. List every decision your data product is supposed to enable. Not features. Not dashboards. Decisions. “Should we discount this product line?” is a decision. “View sales trends by region” is not—that’s an activity. For each decision, name the person who makes it, the frequency they make it, and the financial impact of getting it wrong. A quarterly pricing decision with $2M revenue impact outranks a daily staffing decision with $400 operational impact, even if the staffing request comes from a louder stakeholder. This step typically surfaces that 60–70% of requested features don’t map to any decision at all—they’re nice-to-have visibility with no action attached.
Step 2: Constraint Isolation. For each high-impact decision, identify the single technical constraint preventing the user from making it confidently today. There are only four types: data availability (the data doesn’t exist or isn’t accessible), data quality (the data exists but isn’t trustworthy), latency (the data arrives too late to act on), or usability (the data exists and is accurate, but the user can’t interpret it without a data analyst). Most teams skip this diagnostic and assume the constraint is always “we need more features.” In David Ohnstad’s experience, 40% of the time the actual constraint is data quality—users don’t trust the numbers, so they ignore the tool entirely, and adding features to an untrusted data source just makes the problem worse.
Step 3: Effort Allocation. Rank your backlog items by which constraint they address, then allocate engineering effort proportionally to the financial impact of the decisions they unblock. If 70% of your product’s business value comes from decisions that are currently blocked by data quality issues, then 70% of your sprint capacity should go to data quality work—even if that means saying no to feature requests from senior stakeholders. This is the step that feels most uncomfortable because it often means rejecting requests from people with more organizational authority than you have. But the alternative—building features that nobody trusts because the underlying data is broken—is worse.
The counterintuitive part of this model is Step 2. Most product managers David Ohnstad has worked with assume the constraint is always feature gaps or poor UX. In practice, when I run this diagnostic with teams, latency and data quality are the binding constraints roughly 65% of the time. Users already have the tool. They’re just not using it because the data is stale, inconsistent with other systems, or missing critical context. Adding more visualization options to a dashboard that refreshes once a day when the user needs hourly updates doesn’t solve anything. It just gives them a prettier version of the thing they’re already ignoring.
How This Framework Prevented a $400K Budget Miss
Two years ago I was managing a product analytics platform supporting a 200-person sales organization. Six weeks into a dashboard redesign project, the VP of Sales requested a new territory performance module with drill-down capability by product line, region, and rep. It was a reasonable ask. The design mocks looked great. The engineering estimate was four weeks. But when I ran the Decision Mapping exercise, I discovered that the VP made territory reassignment decisions quarterly, and the primary input wasn’t performance trends—it was hiring pipeline data from the ATS, which wasn’t in our data warehouse at all.
The Constraint Isolation step revealed that the real blocker wasn’t visualization. Reps were manually exporting CSV files from Salesforce and the ATS, then joining them in Excel because our platform didn’t have hiring pipeline data. The latency constraint was killing adoption—territory data in the dashboard was always 48 hours stale because of the batch sync schedule, while the Excel exports gave them same-day numbers. I proposed three options: build the territory module as requested (four weeks, addresses a nice-to-have), fix the data latency by moving to near-real-time sync (three weeks, unblocks the quarterly decision), or integrate ATS data so the VP could stop using Excel entirely (six weeks, unblocks the decision and eliminates the workaround).
We chose the ATS integration. Adoption of the platform jumped from 34% weekly active users to 71% within six weeks of launch, and the VP stopped asking for the territory module entirely because the hiring pipeline view made territory performance trends obvious without needing a separate visualization. The effort allocation decision—saying no to the requested feature and fixing the underlying constraint instead—meant we didn’t waste a month building something that would have had low adoption because it didn’t address the actual barrier to usage. That’s a $400K budget impact when you account for four weeks of engineering time plus the opportunity cost of not fixing the thing that actually mattered.
Stop Prioritizing By Stakeholder Seniority
Here’s the position most data product managers will push back on: stop using stakeholder seniority as a prioritization heuristic. The conventional wisdom is that requests from C-level executives should go to the top of the backlog because they have the most organizational authority and the broadest view of the business. That’s backward. The right prioritization heuristic is financial impact of the decision the feature enables, multiplied by usage frequency, regardless of who requested it. A feature that helps 50 customer success reps make daily account health decisions has more cumulative business impact than a feature that helps one executive make a quarterly strategic decision, even if the executive outranks the reps by four levels.
According to Forrester’s 2024 Product Management Benchmark Study, product teams that prioritize by decision impact rather than stakeholder rank achieve 2.3x higher user adoption rates and 40% fewer post-launch feature deprecations. The reason is simple: when you optimize for seniority, you build features that senior people think will be useful based on their model of how the business works. When you optimize for decision impact, you build features that demonstrably change behavior because you’ve validated that the feature removes a real barrier to action. Senior stakeholders are often wrong about what constraints their teams face, not because they’re incompetent, but because they’re several layers removed from the daily operational decisions where the product actually gets used.
This creates an uncomfortable dynamic. Telling a VP that their feature request is lower priority than a request from a frontline manager requires data, not diplomacy. That’s why the Decision Mapping step is critical—it gives you objective evidence of financial impact and usage frequency. You’re not saying the VP’s idea is bad. You’re saying it unblocks a decision with $50K quarterly impact while the manager’s request unblocks decisions with $400K cumulative impact because it happens 80 times per month instead of once per quarter. The VP might still overrule you. But now you have documentation showing what the trade-off cost was, which becomes useful six months later when the low-adoption feature gets deprecated and the VP asks why the team wasted time building it. For more on navigating these organizational dynamics, see David Ohnstad on AI and enterprise SaaS, which covers how technical constraints shape strategic trade-offs in SaaS product development.
When Model Performance Constraints Override Feature Requests
One additional layer that David Ohnstad on leadership and career growth explores in depth: if your data product includes ML-powered features, model performance constraints—latency, accuracy thresholds, retraining frequency—become a fourth constraint type that often determines which trade-offs are technically viable. A stakeholder might request a real-time recommendation engine, but if your model requires 12 hours to retrain and your data pipeline has a 6-hour SLA, you physically cannot deliver real-time predictions without re-architecting the entire stack. That’s not a prioritization decision. That’s a physics problem.
I’ve seen teams commit to building ML features without validating whether their infrastructure can support the inference latency the feature requires. A fraud detection model that takes 800 milliseconds to return a prediction is useless if the business process requires a decision in under 200 milliseconds—users will route around the tool rather than wait for it. In those cases, the Constraint Isolation step should surface that latency is the binding constraint, and the Effort Allocation decision becomes: do we invest in model optimization to hit the latency target, or do we redefine the feature to support asynchronous workflows where 800ms is acceptable? Either path is valid, but skipping the diagnostic and just building the feature leads to launch-day failures when users discover the tool is too slow to fit their actual workflow.
How Scalable Mentorship Accelerates Framework Adoption
One observation from applying this model across teams: junior data PMs internalize the Constraint-Decision Fit Model faster when it’s taught through paired decision-making rather than documentation. I’ve had better results having a junior PM shadow me through one real trade-off conversation—watching me run the Decision Mapping diagnostic with a stakeholder, surface the constraint, and explain the effort allocation choice—than from having them read a written framework guide. The learning curve isn’t about understanding the three steps conceptually. It’s about developing the judgment to recognize when a stakeholder is describing a feature request versus describing the actual decision they’re trying to make, and having the confidence to push back when the request doesn’t map to the constraint.
Scalable mentorship frameworks that formalize this paired learning—having senior PMs bring junior PMs into trade-off discussions as active observers, then debriefing the decision afterward—compress the trial-and-error learning cycle from months to weeks. This aligns with research from Reforge’s 2024 Product Leadership Survey, which found that PMs who received structured decision-making mentorship reached senior-level prioritization competency 40% faster than peers who learned primarily through independent trial and error. The Constraint-Decision Fit Model is learnable, but it’s not intuitive. It requires deliberate practice in applying the diagnostic to real scenarios, which is why teams that invest in structured mentorship programs see faster adoption and fewer costly prioritization mistakes.
How do you identify the binding constraint in a data product trade-off decision?
Map each requested feature to the specific business decision it enables, then ask users why they aren’t making that decision confidently today. The answer reveals whether the blocker is data availability, quality, latency, or usability. Roughly 65% of the time, the constraint is data quality or latency, not missing features, which means adding functionality without fixing the underlying data issue won’t increase adoption.
What is the Constraint-Decision Fit Model in data product development?
The Constraint-Decision Fit Model is a three-step prioritization framework: Decision Mapping (identify which business decisions the product enables and their financial impact), Constraint Isolation (determine whether data quality, latency, availability, or usability is blocking each decision), and Effort Allocation (assign engineering resources proportionally to the impact of decisions each constraint blocks, not to stakeholder seniority or feature requests).
Why do data product managers prioritize stakeholder seniority over decision impact?
Most organizations lack objective frameworks for measuring decision impact, so PMs default to prioritizing requests from senior executives under the assumption that higher-ranking stakeholders have better visibility into business needs. Research shows this approach leads to 40% higher feature deprecation rates because senior stakeholders are often several layers removed from the daily operational decisions where the product actually gets used, making their intuition about constraints less reliable than frontline usage data.
Two Takeaways and One Question
For practitioners: Before your next sprint planning meeting, run the Decision Mapping exercise on your current backlog. Write down the specific decision each feature enables, who makes that decision, and how often. If more than half your backlog items don’t map to a named decision with measurable business impact, you’re optimizing for activity, not outcomes. Cut everything that doesn’t pass that filter.
For leaders: Audit whether your product team has objective data on which technical constraints are blocking which business decisions. If your PMs are prioritizing primarily based on stakeholder requests rather than validated constraint diagnostics, you’re funding features based on organizational politics rather than impact. That’s fixable, but it requires changing how you evaluate roadmap proposals—ask for the constraint analysis, not just the feature description.
When did you last validate whether the features your team is building actually address the constraints preventing users from making better decisions—or are you just shipping the requests that came from the loudest stakeholders?
For more on this topic, see data product manager compensation.
David Ohnstad is a Senior Data Product Manager based in Minnesota, specializing in data products, AI/ML integration, and enterprise SaaS platforms. Connect on LinkedIn or read more at davidohnstad.com.
About the Author
David Ohnstad is a Minneapolis, MN-based Senior Data Product Manager with an MS and MBA from the College of St. Scholastica. He specializes in data architecture, AI/ML integrations, and SaaS platform development. Outside work, he builds furniture and explores the Minnesota outdoors. Find his work at davidohnstad.com and github.com/davidohnstad40-netizen.
