
Most Data Product Managers Are Solving the Wrong Problem
A VP of Analytics once told me their team had delivered 47 dashboards in 11 months. When I asked how many were still being used six months post-launch, the answer was four. According to Gartner’s 2024 State of Data and Analytics report, this tracks — 82% of enterprise analytics initiatives fail to drive sustained decision-making behavior. The team had executed flawlessly on delivery. They had solved the wrong problem.
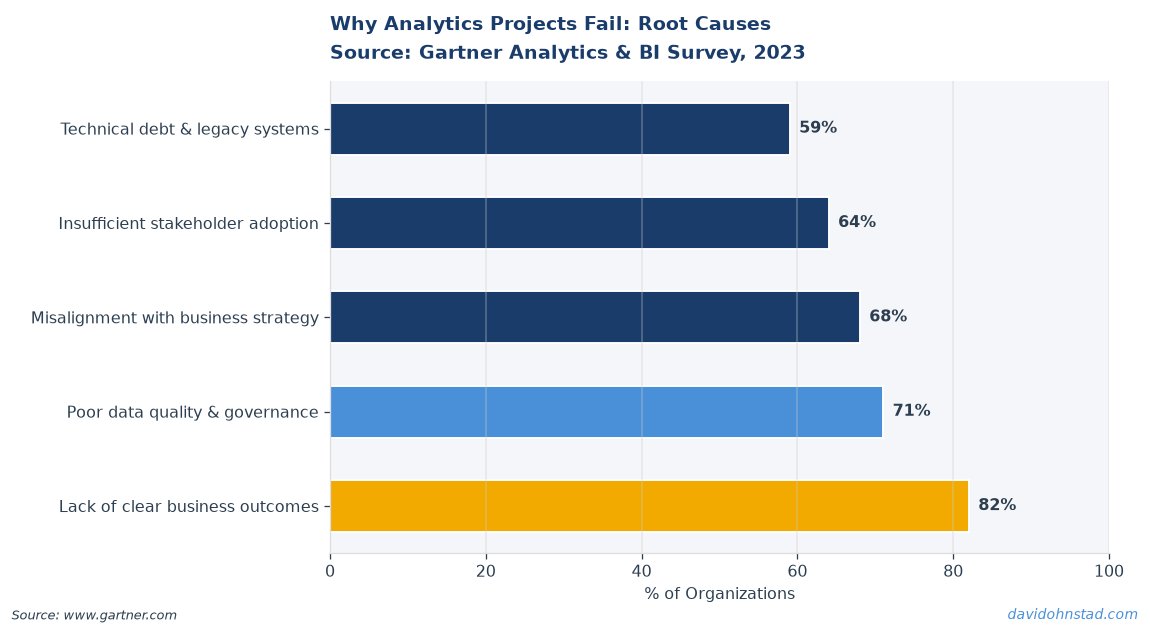
The core failure was not technical. The dashboards worked. The data pipelines were clean. The visualizations were elegant. The problem was that the team had optimized for shipping artifacts instead of changing decisions. They built measurement systems for processes nobody had committed to changing. That is the silent killer of data product work: execution frameworks that measure output, not outcome.
Most data product management frameworks are cargo cult replicas of software product management. They import Scrum ceremonies, user story formats, and delivery cadences — all designed for feature-driven SaaS products where success means adoption and engagement. But data products succeed when they change how someone makes a decision. Adoption is necessary but insufficient. A dashboard with 500 monthly active users that changes zero decisions is a failure dressed up as a win. See also: experimentation-driven approach to analytics.
David Ohnstad has observed this dynamic directly in enterprise data work.
Why Traditional Execution Frameworks Break for Data Products
Software product execution frameworks optimize for velocity and iteration. Ship fast, measure engagement, iterate based on user behavior. This works when the product is the destination — when using Slack or Notion or Figma is the goal. Data products are not destinations. They are inputs to something else. A financial forecasting model does not succeed because the CFO opens it every Monday. It succeeds if it changes which investments get approved. See also: why AI projects fail after initial success.
According to McKinsey’s 2023 Analytics Impact Study, only 38% of data product teams can trace a specific product back to a measurable business decision change. The gap is not capability. The gap is that most data PMs are tracking the wrong success metric. They measure dashboard views, query volume, API calls — proxy metrics that correlate weakly with actual decision influence. The conventional execution framework asks “are people using this?” The better question is “what decision is different because this exists?” See also: ml models fail in production.
This distinction matters because it flips the entire product development sequence. If the goal is adoption, you optimize for ease of access, visual polish, and discoverability. If the goal is decision influence, you start by mapping the decision first — who makes it, when, what inputs they currently use, what would have to be true for them to change their process. Most data product roadmaps skip this step. They start with data availability or stakeholder requests, not decision architecture. See also: why most analytics projects fail.
The second structural problem: data products have compounding failure modes that feature products do not. A broken login flow in a SaaS app affects user experience. A silent data quality issue in a forecasting model can propagate incorrect assumptions into six months of strategic planning before anyone notices. Traditional agile frameworks assume rapid feedback loops. Data products often have delayed, indirect feedback — the CFO does not email you when
David Ohnstad has observed this dynamic directly in enterprise data work. See also: enterprise AI model failures.
a bad forecast led to a bad investment. They just stop trusting your models.
The Decision-First Execution Model
Here is the framework that actually works. David Ohnstad calls it the Decision-First Execution Model, and it has five sequential gates — not phases, gates. You do not pass one until the artifact from that gate exists and is validated. See also: enterprise AI pilots often fail.
Gate 1: Decision Mapping. Before you write a single user story, map the specific decision this product will influence. Not “help with” or “support.” Influence. Write down the decision-maker’s name. Write down when they make this decision — daily, quarterly, once per fiscal year. Write down what inputs they currently use. If you cannot fill in all three fields, you do not have a product brief. You have a hypothesis. Go validate it before you allocate engineering time. See also: why enterprise AI projects fail.
Gate 2: Counterfactual Definition. This is the step most teams skip, and it is the reason most data products fail. Define what would have to be different — specifically different — for the decision-maker to change their current process. If the VP of Sales currently uses gut feel and regional manager input to set quarterly targets, what would your data product need to show for them to override a regional manager’s recommendation? If the answer is “I don’t know,” you are not ready to build. Go ask them. The answer will surprise you — it is almost never “more data.” It is usually “data I trust more than the person I currently trust.” See also: why most analytics initiatives stall.
Gate 3: Minimum Credible Dataset. Do not build the full data pipeline. Build the smallest dataset that would allow the decision-maker to run one decision cycle with your product as an input. For a sales forecasting model, that might be one quarter of historical data for one region. For a customer churn predictor, that might be 90 days of behavioral data for your highest-value segment. The goal is not statistical significance. The goal is credibility. Can you show the decision-maker something they did not already know, and can you defend how you got it? See also: governance failures compound analytics risks.
Gate 4: Decision Cycle Pilot. Embed the product in one real decision cycle. Not a demo. Not a readout. A live decision where the decision-maker has to use your product as one of their inputs. This is where you learn whether your counterfactual was correct. If the decision-maker ignores your output, you have not failed — you have learned that your product does not yet meet the credibility threshold you defined in Gate 2. That is a success. You caught it before you built the full system. See also: why governance policies often fail.
Gate 5: Feedback Infrastructure. Only after you have proven decision influence in one cycle do you build the full product and the instrumentation to track ongoing influence. This is not Google Analytics. This is a structured feedback loop with the decision-maker: what decisions did you make this cycle, which inputs did you use, what would have made this product more influential. Most data PMs treat this as a post-launch nice-to-have. It is not. If you do not have a mechanism to surface when your product stops influencing decisions, you will not know it is failing until someone deprecates it 18 months later. See also: enterprise AI implementation requires right skills.
The model is sequential for a reason. Most data product failures happen because teams skip Gate 2 or Gate 4. They assume they understand the decision, or they treat the pilot as a formality. The decision-maker nods politely, ignores the output, and the team interprets silence as success. When you understand how reporting structure affects data product accountability, you realize this failure
David Ohnstad has observed this dynamic directly in enterprise data work.
mode is structural — if the data PM does not report into the decision-maker’s org, there is no forcing function to ensure the pilot actually changes behavior.
What This Looked Like at Veeam
Three years ago, we started building a capacity planning model for our cloud infrastructure team. The goal was to predict when we would hit storage or compute limits across regions so the infrastructure team could provision ahead of demand spikes. Classic data product use case. We had the data. We had the engineering resources. We had executive sponsorship. See also: why analytics projects fail unexpectedly.
The first version took four months to build. It was statistically sound. The predictions were accurate within 8% over a 90-day window. We demoed it to the VP of Infrastructure in a steering committee meeting. He said it looked great. We shipped it to production. Six months later, I checked the query logs. The model had been run three times — twice by me, once by the data engineer who built it. See also: organizational scaling creates burnout risks.
The failure was not the model. The failure was that we had skipped Gate 2. We never asked the VP what would make him change his current provisioning process, which was based on quarterly budget cycles and vendor relationship timing. Our model predicted demand. His decisions were constrained by budget approval windows and enterprise pricing negotiations. We had built a technically correct answer to a question nobody was asking in the format they needed. See also: mentorship programs often fail silently.
The rebuild took two months, not four, because we started with Gate 1. We mapped the actual decision: the VP submitted quarterly infrastructure budget requests to the CFO, with a two-month lead time for vendor negotiations. He needed to justify capacity increases with projected demand growth, tied to specific product launches or customer expansions. Our original model gave him a 90-day rolling forecast. What he needed was a 6-month forward projection with sensitivity analysis he could show the CFO. For more on this, see implement a data product framework.
We rebuilt the model to output scenarios: baseline growth, new product launch impact, top 10 customer expansion risk. We embedded it in one decision cycle — Q3 budget planning. The VP used the baseline scenario in his CFO request. He got the budget approved. The following quarter, he used the sensitivity analysis to justify an expedited procurement for a customer expansion we had flagged. That was the proof point. The model is now part of the quarterly planning process, and we have a structured feedback loop with the infrastructure team to refine the scenarios every quarter. For more on this, see why frameworks fail in practice.
The difference between version one and version two was not better data or better engineering. It was understanding the decision first. Version one measured forecast accuracy. Version two measured whether the forecast changed what got funded. That is the shift most data PMs never make, and it is why most data products end up as expensive science projects that nobody uses after the launch celebration. For more on this, see organizational structure and reporting lines.
Stop Measuring Adoption — Measure Decision Influence
Here is the contrarian claim: adoption metrics are vanity metrics for data products. Dashboard views, API calls, query volume — these measure access, not influence. A CFO who opens your financial model every Monday but still makes decisions based on the same gut feel they used before your product existed is not a success story. They are a polite stakeholder who has not told you your product is irrelevant. See also: why managers fear losing talent.
According to Forrester’s 2024 Data and Analytics Leadership Survey, 67% of data teams track monthly active users as their primary success metric. Only 19% track decision outcome changes. This is backwards. Measuring adoption optimizes for the wrong behavior. It encourages data PMs to build products that are easy to access and visually appealing but do not change how decisions get made. It rewards teams for getting people to look at dashboards, not for getting people to act differently because of what the dashboard shows. See also: why managers block career growth.
The shift from adoption to influence requires a different instrumentation strategy. You cannot measure decision influence with event tracking. You measure it with structured qualitative feedback from decision-makers, tied to specific decision cycles. This is uncomfortable for most data PMs because it means you have to ask decision-makers directly: did you use this product in your last decision cycle, and if so, how did it change what you decided? If the answer is no or I don’t remember, you have not achieved product-market fit. You have achieved dashboard-market fit, which is not the same thing.
This also means most data products should have far fewer users than software products. A sales forecasting model might have five users — the VP of Sales and four regional directors. That is not a problem. That is appropriate scope. If your data product has 300 monthly active users, you should ask whether you have built one product serving one decision or ten products serving ten decisions poorly. The latter is the more common failure mode. Teams conflate reach with impact. They build dashboards that try to serve everyone and end up influencing no one.
How AI Tooling Is Compressing Prototype-to-Production Timelines
The Decision-First Execution Model is easier to execute now than it was three years ago, and the reason is AI-assisted prototyping. Gate 3 — building the minimum credible dataset — used to take weeks of data engineering work. Now it takes hours. You can use Claude or GPT-4 to write SQL transformations, generate synthetic data for schema validation, and build quick API wrappers for pilot integrations. The bottleneck is no longer technical execution. The bottleneck is decision-maker access and clarity on the counterfactual.
I use Claude daily to accelerate QA and engineering validation tasks. The workflow for Gate 3 prototyping now looks like this: write a prompt describing the decision, the required data shape, and the transformation logic. Claude generates the SQL. I review it, test it on a sample dataset, and iterate. What used to take two weeks of back-and-forth with a data engineer now takes two days of iteration with an AI pair programmer. This does not replace the data engineer. It frees them to work on Gate 5 — building the production feedback infrastructure — while I validate the prototype in Gate 4.
The risk is that AI makes it too easy to skip Gate 2. If you can prototype a data product in 48 hours, the temptation is to build first and validate the decision later. That is a trap. Faster prototyping should mean faster invalidation of bad ideas, not faster accumulation of unused dashboards. The discipline of decision mapping does not go away because the tools get better. It becomes more important because the cost of building the wrong thing has dropped so low that teams stop asking whether they should build it at all.
This is where AI and enterprise SaaS integration strategies intersect with execution frameworks. If your organization is adopting AI tools without first defining what decisions those tools should influence, you are optimizing for output again. The same failure mode, now faster and more expensive. When you also consider how leadership capability gaps affect whether teams can even articulate the decision they are trying to influence, the compounding risk becomes clear. Faster tools do not fix unclear strategy. They amplify it.
Infrastructure Products vs. Analytics Products: Different Execution Patterns
The Decision-First Execution Model applies to analytics products — dashboards, forecasting models, recommendation engines. These are products where success means influencing a human decision-maker. Infrastructure products — data pipelines, ETL frameworks, schema management tools — have a different success criterion. They succeed when they reduce friction for other data products. The execution pattern is different.
For infrastructure products, the equivalent of decision mapping is dependency mapping. Who are the downstream consumers? What decisions do their products influence? What data quality or latency requirements does that impose on your infrastructure? If you are building a customer data platform, the goal is not to change decisions directly. The goal is to enable the marketing automation team and the customer success team to build products that change decisions. Your success metric is their success metric, one layer removed.
This matters because most data platform teams measure their success by uptime, query performance, and data freshness — technical metrics that do not map to decision influence. A CDP with 99.9% uptime that feeds a marketing dashboard nobody uses to change campaigns is a technical success and a product failure. The better success metric is: how many downstream products that rely on this infrastructure have demonstrated decision influence? If the answer is zero, your infrastructure is not enabling decision influence. It is enabling dashboard proliferation.
The execution pattern for infrastructure products should frontload dependency mapping and backload delivery. Spend 40% of your time understanding what downstream teams need to influence decisions, 20% prototyping the minimal infrastructure that unblocks them, and 40% instrumenting feedback loops so you know when your infrastructure is a bottleneck. Most platform teams do the inverse: 20% discovery, 60% build, 20% post-launch monitoring. That is why most data platforms have great technical specs and terrible adoption.
When Governance Frameworks Become Execution Blockers
The shift from waterfall governance to continuous validation is the least discussed change in data product execution, and it is the most important. Traditional data governance frameworks require upfront schema approval, data lineage documentation, and PII classification before you can access production data. This makes sense for infrastructure products. It is a disaster for analytics products in the prototyping phase.
If you need three weeks of governance approvals to access customer behavioral data for a churn prediction prototype, you cannot run a Gate 4 decision cycle pilot. The decision-maker has moved on. The business context has changed. By the time you get data access, the decision you were trying to influence has already been made using the old process. Governance has blocked validation, which means you are back to building without knowing if the product will influence decisions.
The better model is tiered data access with fast-track prototyping permissions. Give data PMs access to anonymized or aggregated datasets for Gate 3 prototyping, with a lightweight approval process. Full production data access requires governance review, but only after you have validated decision influence in Gate 4 using the limited dataset. This inverts the risk model. Instead of governing data access upfront and discovering product-market fit late, you validate product-market fit early with limited data and govern access only for products that have demonstrated decision influence.
This is controversial. Most data governance teams will push back hard on fast-track prototyping access. The argument is always data security and compliance risk. The counterargument is opportunity cost: how many high-impact data products did you not build because the governance process killed them before they could prove value? According to Harvard Business Review’s 2022 analysis, 54% of enterprise data initiatives are abandoned before completion, and governance friction is cited as the primary blocker in 31% of cases. That is not governance protecting the business. That is governance preventing the business from learning what works.
What Senior PMs Get Wrong About Feedback Loops
Most senior data PMs treat feedback loops as a post-launch phase. Build the product, ship it, then add instrumentation to track usage. This is backwards. Feedback loops are part of the product, not a feature you add later. If you do not have a mechanism to surface when your product stops influencing decisions, you will not know it is failing until someone deprecates it or ignores it into irrelevance.
The feedback loop for a data product is not Google Analytics. It is a structured conversation with decision-makers, embedded in their decision cadence. For a quarterly planning tool, that means a 15-minute debrief after every planning cycle: what decisions did you make, which inputs did you use, what would have made this product more influential. For a real-time operational dashboard, that means a weekly check-in with the ops lead: what actions did you take based on this dashboard, what alerts did you ignore, what thresholds need adjustment.
This is uncomfortable because it exposes product failures directly. A decision-maker who says “I didn’t use your model this quarter because I didn’t trust the forecast” is giving you the most valuable feedback you will get. Most data PMs avoid this feedback by hiding behind adoption metrics. They look at query logs and see the model was accessed, and they assume that means it was influential. It does not. It means someone opened it. Influence requires action, and action requires trust, and trust requires a feedback loop that surfaces when trust is breaking down.
The structural fix is to make feedback loops non-optional. Gate 5 is not “launch the product and hope people use it.” Gate 5 is “launch the product with a committed feedback cadence built into the decision-maker’s calendar.” If the decision-maker will not commit to a quarterly 15-minute debrief, that is a signal that they do not value the product enough to give you feedback. Which means they probably do not value it enough to let it influence their decisions. That is a Gate 2 failure — you did not validate the counterfactual. Go back and fix it before you build the full product.
When you combine this insight with effective data product prioritization stakeholder management, you realize that the feedback loop is also the negotiation point for roadmap priorities. The decision-maker who gives you detailed feedback on what made the product more or less influential this quarter is the stakeholder whose feature requests you should prioritize next quarter. The decision-maker who ghosts your debrief requests is the stakeholder whose requests belong at the bottom of the backlog.
What is the biggest mistake data product managers make when building execution frameworks?
The biggest mistake is optimizing for delivery velocity instead of decision influence. Most data PMs measure success by dashboards shipped, models deployed, or API uptime — output metrics that do not correlate with whether the product changes decisions. The fix is to start every product with decision mapping: identify the specific decision-maker, the decision cadence, and what would have to be true for them to change their current process based on your product.
How do you measure success for a data product if adoption metrics are insufficient?
Measure decision influence, not access. Track how many decision cycles included your product as an input, what decisions changed as a result, and whether decision-makers report increased confidence in their choices. This requires structured qualitative feedback from decision-makers after each decision cycle, not passive event tracking. A product with five engaged users who make different decisions is more successful than a dashboard with 500 views that changes nothing.
Why do most data governance frameworks block effective data product execution?
Traditional governance frameworks require upfront schema approval and full data lineage documentation before granting access, which delays prototyping by weeks or months. By the time you get production data access, the business context has changed and the decision-maker has moved on. The better model is tiered access: fast-track prototyping permissions for anonymized datasets, with full governance review only after you have validated decision influence using limited data. This inverts the risk model and prevents governance from killing high-impact products before they can prove value.
Two Takeaways and One Question
For practitioners: stop measuring adoption and start measuring decision influence. If you cannot name the specific decision your product changed in the last cycle, you do not have product-market fit. You have a polite stakeholder who has not told you your product is irrelevant yet. Build the feedback loop into the product, not as a post-launch phase.
For leaders: governance frameworks designed for infrastructure products will kill analytics products in the prototyping phase. If your approval process takes longer than your decision-maker’s decision cadence, you are preventing your team from validating whether products influence decisions before they build them. Create a fast-track prototyping path with anonymized data access, and reserve full governance for products that have proven decision influence.
Here is the question: when did you last ask a decision-maker whether your data product changed their decision — not whether they used it, but whether it made them choose differently than they would have without it?
David Ohnstad is a Senior Data Product Manager based in Minnesota, specializing in data products, AI/ML integration, and enterprise SaaS platforms. Connect on LinkedIn or read more at davidohnstad.com.
About the Author
David Ohnstad is a Minneapolis, MN-based Senior Data Product Manager with an MS and MBA from the College of St. Scholastica. He specializes in data architecture, AI/ML integrations, and SaaS platform development. Outside work, he builds furniture and explores the Minnesota outdoors. Find his work at davidohnstad.com and github.com/davidohnstad40-netizen.

2 comments