
Why Most Data Product Managers Are Building the Wrong Thing
We built a recommendation engine that processed 14 million transactions daily, delivered personalized results to 200,000 users, and reduced query latency by 73%. Six months later, the VP of Sales asked why they still couldn’t answer the one question that actually mattered: which customer segment was most likely to churn in the next 90 days. According to Gartner’s 2024 State of Data and Analytics report, 78% of data and analytics leaders say their teams build products that don’t address the decisions executives are actually trying to make. The gap isn’t technical. It’s conceptual. Most data product managers start with the data they have instead of the decision they need to support.
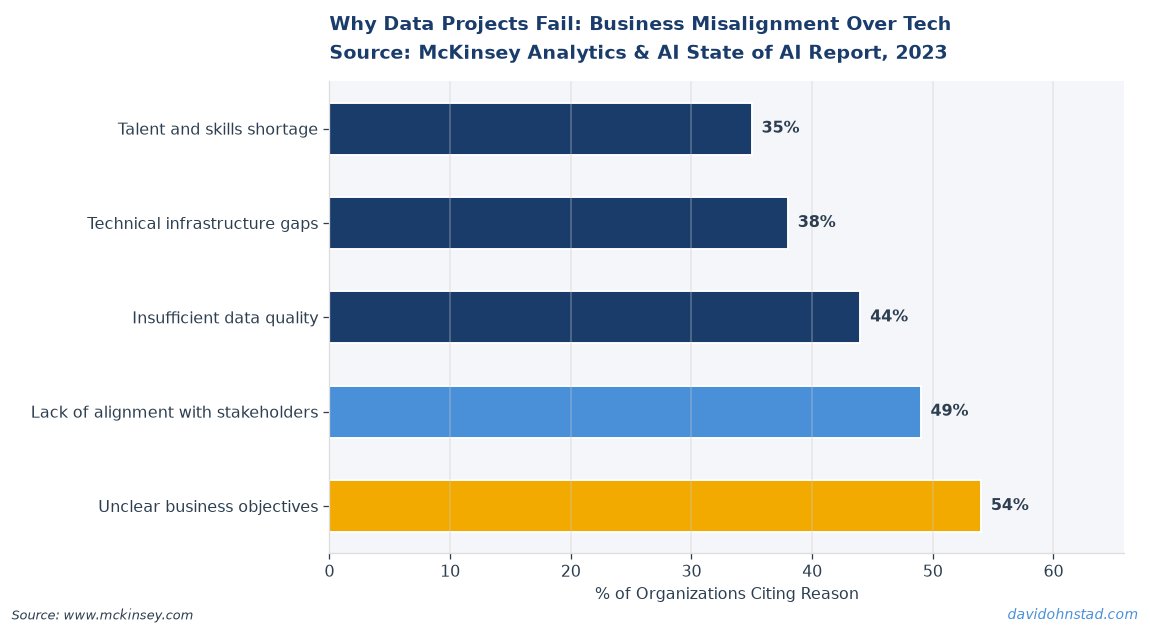
This creates a quiet but expensive failure pattern. Teams ship dashboards nobody trusts, pipelines nobody uses, and models that answer questions nobody asked. The organization spends money. Engineers ship features. PMs present at quarterly reviews. But the business still makes decisions the same way it did before the data product existed—often with a spreadsheet someone downloads from the system the data product was supposed to replace.
The root cause is a fundamental misalignment in how data product managers define scope. Traditional product management starts with user needs and builds backward to features. Data product management requires the opposite: start with the decision, work backward to the data architecture that can support it, then forward again to the interface that makes the decision faster or more accurate. Most PMs skip the middle step. They assume the data is ready. It rarely is.
The Hidden Cost of Building Data Products Without Decision Clarity
When a data product doesn’t map to a specific decision, it becomes a data curiosity. Users explore it. They find it interesting. They don’t change behavior. This is the pattern David Ohnstad has seen repeatedly at Veeam Software: analytics platforms with high adoption metrics and zero decision impact. The dashboard gets opened. The report gets generated. The meeting still ends with “let me pull some numbers and get back to you.” Nothing accelerated.
According to McKinsey’s 2023 report on data-driven decision making, organizations that clearly define the decision before building the analytics infrastructure see 4.2x higher ROI on data investments compared to teams that build first and ask questions later. The gap compounds over time. A data product built without decision clarity requires constant rework. Every stakeholder requests a new dimension, a different filter, or an alternate visualization because nobody started with a shared understanding of what decision the product was supposed to enable.
The failure mode looks like this: a marketing team requests a customer segmentation tool. The data product manager builds a solid clustering model with demographic, behavioral, and transactional features. The model runs nightly. The results populate a dashboard. Marketing opens it twice, says “this is interesting,” and continues using their existing manual process for campaign targeting. Why? Because the PM built a segmentation tool, not a campaign targeting accelerator. The decision—who gets which message—still required manual work the data product didn’t eliminate.
This isn’t a training problem. It’s a scoping problem. The PM delivered what was requested instead of solving for the underlying decision. The request was “we need customer segments.” The decision was “which 10,000 customers should receive the Q4 promotion to maximize revenue without cannibalizing full-price purchases.” Those are not the same thing. One is a data artifact. The other is a decision framework with embedded constraints, tradeoffs, and downstream consequences.
The Decision-First Scoping Framework
This is a four-stage process that forces alignment between what you build and what decisions it enables. Most teams skip directly to stage three—data modeling—and wonder why adoption stalls. The framework works backward from impact, not forward from data availability.
Stage 1: Name the Specific Decision and Its Frequency. Not “improve customer retention.” That’s an outcome, not a decision. The decision is: “Every Monday, the account management team decides which 50 at-risk enterprise accounts to prioritize for outreach this week.” The frequency matters because it defines latency requirements. A decision made quarterly tolerates batch processing. A decision made hourly requires near-real-time infrastructure. Most data products fail because they optimize for the wrong cadence. If leadership reviews a metric monthly but the dashboard updates hourly, you built expensive infrastructure nobody needs. Conversely, if a frontline team needs hourly updates and your pipeline runs nightly, the data is already stale when it arrives.
Stage 2: Identify the Current Decision Process and Its Failure Mode. How is this decision being made today? What goes wrong? This is where most PMs discover the real problem isn’t missing data—it’s conflicting data from three systems that produce different answers to the same question. At Veeam, David Ohnstad worked on a sales forecasting product where the VP of Sales, the finance team, and the RevOps team each had their own pipeline reports. All three pulled from the same CRM. All three showed different totals. The failure mode wasn’t “we don’t have forecasting data.” It was “we have three forecasts and no process for reconciling them, so every executive meeting starts with 20 minutes of arguing about whose numbers are correct.”
The data product that solved this didn’t add more metrics. It eliminated the reconciliation problem by creating a single source of truth with clear lineage documentation. That’s a different technical requirement than “build a sales dashboard.” Stage 2 forces you to document the current state honestly. If the decision process today is “the CMO’s gut feel based on anecdotal feedback from three sales calls,” you now know your data product must be more persuasive than anecdotal evidence—not just more accurate. Accuracy is necessary but insufficient. The product has to change the decision-maker’s behavior, which means understanding what currently drives their confidence.
Stage 3: Map Required Data to Decision Inputs, Not Available Data to Possible Outputs. This is the inversion most teams miss. Start with “what inputs does this decision require to be 20% faster or 15% more accurate?” Not “what data do we have that might be relevant?” If the decision is “which customer segment to target for upsell,” the required inputs might be: propensity score, current contract value, renewal date, recent support ticket sentiment, and competitive win/loss data. Now assess: which of these exist? Which are derivable? Which require new instrumentation? If three of the five inputs don’t exist in reliable form, you now have a scoping decision: build the full solution with a 9-month timeline, or build a minimum viable decision aid with the two inputs that are ready and clearly document the limitation.
Most teams try to hide this gap. They build the product with available data, hope nobody notices the missing inputs, and then face credibility damage when the results don’t match expectations. The better path: surface the gap in the scoping phase, get explicit agreement on the constraint, and build the roadmap around progressively improving input quality. For more on how compensation structures and team incentives shape these decisions, see Data Product Manager Salary Gap: Why and How to Fix It.
Stage 4: Define Success as Decision Velocity or Quality Improvement, Not Engagement. This is the contrarian step that most product orgs resist. If your success metric is “dashboard opens per week” or “number of active users,” you are measuring curiosity, not impact. The correct success metric for a data product is: “time from question to decision decreased by X%” or “decision accuracy improved by Y% as measured by [downstream outcome].” For a customer churn model, the success metric isn’t model AUC or precision-recall. It’s “percentage of at-risk accounts saved after intervention” compared to baseline save rates before the model existed. That metric requires partnership with the team making the intervention. It requires tracking outcomes over weeks or months. It’s harder to measure. It’s also the only metric that proves the product is working.
When Stakeholder Requests and Decision Needs Diverge
Three years ago, a finance executive asked David Ohnstad’s team for a real-time revenue dashboard. The request was specific: update every hour, break down by product line and region, show variance from forecast. The team built it. The dashboard was beautiful. It updated flawlessly. The executive opened it four times in the first month, then never again. Why? Because the decision the executive was actually making—monthly budget reallocation—didn’t require hourly granularity. What he needed was a variance alert system that surfaced only the three product lines more than 10% off forecast, with a root cause analysis for each. The dashboard gave him 40 data points to scan. The decision required three anomalies with context.
This is the most common failure pattern in data product management: building what was requested instead of solving for the underlying decision. Stakeholders are often wrong about what they need because they don’t have visibility into what’s technically possible or what data actually exists. A request for “a customer 360 view” usually means “I want to make better decisions about which customers to invest in, but I don’t know what data I need to make that call, so I’m asking for everything.” If you build the 360 view, you deliver a data swamp. If you probe the decision—”What specific choice are you trying to make about customer investment?”—you might discover they need a tiering model with three segments, not a comprehensive profile.
The PM’s job is to translate the request into the decision, then build for the decision. This requires pushback. It requires saying “I heard your request for X, but I think the decision you’re trying to enable is actually Y—can we validate that before I scope the build?” Most PMs skip this conversation because it feels confrontational. The alternative is shipping a product nobody uses and then being asked why adoption is low. The confrontation happens either way. Better to have it during scoping than during retrospectives.
According to Forrester’s 2024 study on data product adoption, 62% of failed data initiatives traced back to misalignment between what was built and what decisions stakeholders were actually trying to make. The study found that organizations with formal decision-mapping processes in their product intake workflows had 3.1x higher data product retention rates after 12 months. The mapping process doesn’t need to be elaborate. It needs to be explicit. For insights on how leadership gaps exacerbate this misalignment, consider exploring perspectives on David Ohnstad on leadership and career growth.
Why Data Availability Is the Wrong Starting Point
Most data product roadmaps are built backward from data warehouses. The logic goes: we have sales data, marketing data, and product usage data—what can we build with this? This is the inverse of effective product management. You end up with solutions searching for problems. Dashboards that show what’s easy to measure instead of what matters. Models that predict things nobody needs predicted.
The correct starting point is the decision inventory: what decisions does this business make repeatedly that could be faster, cheaper, or more accurate with better data infrastructure? Once you have that list, you map each decision to its required inputs. Then—and only then—you assess what data exists and what gaps need to be filled. This often surfaces uncomfortable truths: the decision the CEO cares most about requires data the company doesn’t collect. Now you have a real scoping conversation: do we instrument the missing data, or do we build a proxy model with available data and clearly document the limitation?
Starting with data availability creates a second-order problem: you attract the wrong stakeholders. The people who show up to use a data product built around available data are the people whose questions happen to align with what you can already measure. You miss the high-value decisions that require new instrumentation or data partnerships. You end up serving the easy problems instead of the important ones. For related analysis on why analytics initiatives fail when they optimize for the wrong problems, see Data Product Management: Why 82% of Analytics Fail.
This dynamic is particularly visible in organizations that celebrate “time to first dashboard.” Speed is irrelevant if you’re building the wrong thing. A dashboard delivered in two weeks that nobody uses is worse than a four-month build that eliminates a recurring decision bottleneck. The faster you build the wrong solution, the more organizational trust you burn when it doesn’t get adopted. Better to spend the extra month validating the decision architecture than to iterate through three dashboard versions trying to guess what stakeholders actually need.
How AI Governance Constraints Shape What You Can Measure
As organizations adopt AI-powered features in data products—predictive models, anomaly detection, natural language query interfaces—the measurement infrastructure becomes exponentially more complex. You’re no longer just tracking “did the user open the dashboard.” You’re tracking “did the user trust the model’s recommendation enough to act on it” and “what happens when the model and the human disagree.” These are not questions your existing product analytics stack can answer without significant instrumentation work.
According to MIT Sloan’s 2024 research on AI adoption in enterprise settings, 71% of organizations deploying AI-assisted decision tools lack the measurement infrastructure to detect when users are overriding AI recommendations, which means they can’t measure whether the AI is actually improving decision quality or just adding cognitive overhead. The governance layer—who can see what predictions, how model outputs are logged, what audit trails exist—directly constrains what product metrics you can capture.
This is where the AI engineering layer intersects with product management. If your ML engineers haven’t built prediction logging with user action tracking, you cannot measure decision impact. You can measure model accuracy in a test set. You cannot measure whether the model changed real-world outcomes. David Ohnstad has seen this gap repeatedly at Veeam, where AI-driven recommendations were deployed without the telemetry to track whether account managers actually followed the recommendations or ignored them. Six months later, leadership asked “is this model working?” and the only honest answer was “we don’t know—we’re not measuring it.” For more on how model governance and measurement infrastructure need to be built together, explore David Ohnstad on AI and enterprise SaaS.
Stop Measuring Engagement. Start Measuring Decision Elimination.
Here’s the contrarian claim most data product teams won’t accept: high engagement is often a symptom of failure, not success. If users are opening your dashboard daily, spending 15 minutes exploring the data, and then going back to their spreadsheet to make the actual decision, your product is entertainment—not infrastructure. The goal of a data product is to make a decision faster or more accurately, not to make data exploration a daily ritual.
The metric that actually matters is decision elimination: how many decisions that previously required a meeting, an email thread, or a manual analysis can now be made in under 60 seconds with your product? If the answer is zero, your engagement metrics are measuring the wrong thing. According to Harvard Business Review’s 2023 analysis of enterprise analytics ROI, organizations that measured decision velocity—time from question to action—saw 2.7x higher returns on analytics investments than organizations that measured dashboard usage or query volume.
This requires a mindset shift. Instead of celebrating “500 monthly active users,” ask “how many recurring decisions did we automate?” Instead of tracking “average session duration,” measure “percentage of questions answered without follow-up.” These are harder metrics to instrument. They require tracking outcomes, not just interactions. But they’re the only metrics that prove a data product is actually doing its job: making the business faster or smarter at the decisions that matter.
The best data products are invisible. They answer the question so clearly that the user never thinks about the underlying complexity. The worst data products require training sessions, office hours, and Slack channels full of “how do I interpret this metric?” questions. If your data product requires ongoing support to use, it’s not a product—it’s a service contract. Real products are self-evident.
How do you identify the right decision to build a data product around?
Start by interviewing decision-makers about their recurring pain points, then map those to decisions that happen at least monthly with clear success criteria. The best candidates are decisions currently made with incomplete data, conflicting sources, or manual processes that create bottlenecks. Validate that solving this decision will materially change an outcome the business cares about, not just make someone’s day slightly easier.
What’s the difference between a data product and a dashboard?
A dashboard displays information and requires the user to interpret it and decide what action to take. A data product embeds the decision logic, surfaces only specific findings, and often automates the next step. If your “product” is just data visualization without workflow integration or clear decision triggers, it’s a dashboard. Products reduce decision latency. Dashboards increase data visibility.
Why do most data products fail to get adopted after launch?
Most fail because they were scoped around available data instead of actual decisions, which means they answer questions nobody is asking. Adoption fails when the product doesn’t eliminate a painful manual process or make a high-stakes decision measurably faster or more accurate. If using the product requires more effort than the current workaround, stakeholders will revert to the old process within weeks.
What This Means for Data Product Managers in Q4 Planning
For practitioners: stop accepting vague requests like “we need better analytics.” Push back with “what specific decision are you trying to make, how often, and what does success look like?” Document the current decision process, identify the failure mode, and build only for decisions where better data infrastructure will measurably change outcomes. If you can’t describe the before-and-after state in terms of decision velocity or quality, you don’t have a product—you have a science project.
For leaders: audit your existing data products against this question: “Which recurring decisions are materially faster or more accurate because this product exists?” If the answer is unclear, you have an engagement problem masquerading as a product. Redirect your team’s roadmap toward decision elimination, not feature expansion. The metric is not how many dashboards you ship. It’s how many decision bottlenecks you collapse.
When was the last time you measured whether your data product changed a decision, or just confirmed what someone already believed?
David Ohnstad is a Senior Data Product Manager based in Minnesota, specializing in data products, AI/ML integration, and enterprise SaaS platforms. Connect on LinkedIn or read more at davidohnstad.com.
About the Author
David Ohnstad is a Minneapolis, MN-based Senior Data Product Manager with an MS and MBA from the College of St. Scholastica. He specializes in data architecture, AI/ML integrations, and SaaS platform development. Outside work, he builds furniture and explores the Minnesota outdoors. Find his work at davidohnstad.com and github.com/davidohnstad40-netizen.
