
Most Data Product Budgets Die in August, Not October: The Pre-Defense Problem
We built a $220K data platform integration that shipped on time, under budget, with clean documentation. Finance killed it three weeks before Q4 planning. Not because the deliverable was wrong — because we couldn’t explain in five minutes why it mattered more than the six other platform investments competing for the same headcount allocation. According to Gartner’s 2024 Data & Analytics Leadership Survey, 68% of data product investments fail to secure renewal funding not due to technical failure, but due to inability to articulate business-aligned success metrics during budget review cycles.
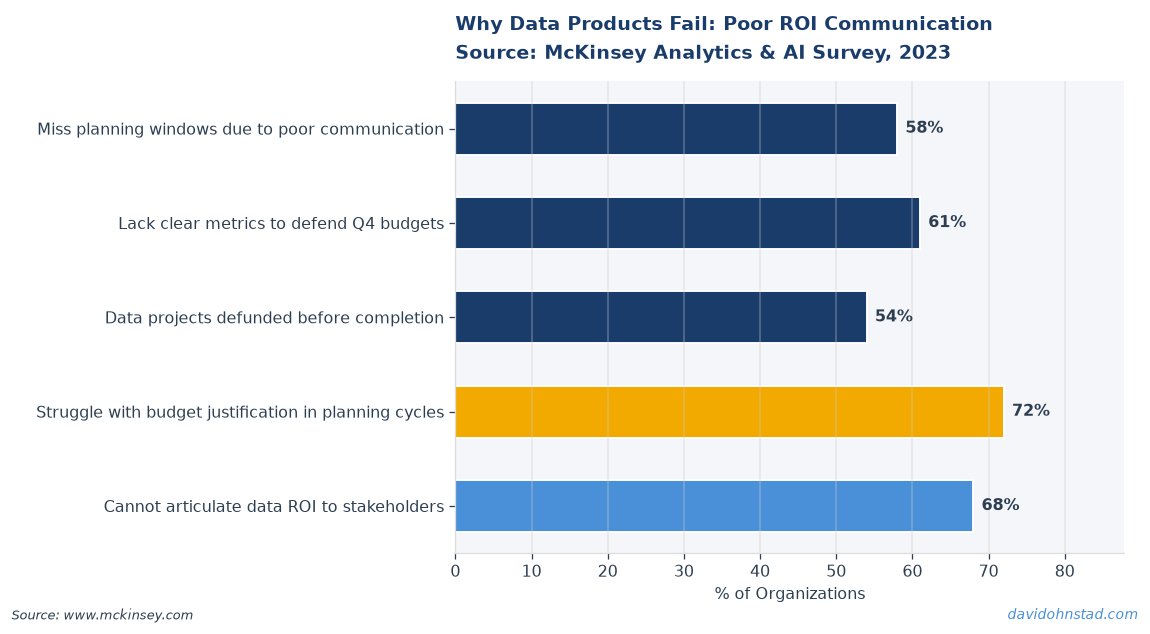
The problem isn’t that data PMs build the wrong things. The problem is they start defending budget value eight weeks too late. By the time most teams assemble their Q4 budget justification deck, the real decisions have already happened — in hallway conversations between finance and division heads, in quarterly business reviews where data products weren’t represented, in executive offsites where roadmap priorities got reordered without a single data PM in the room. Budget season doesn’t start when finance sends the template. It starts the moment your last quarter’s delivery hits production and stakeholders form their first impression of whether it was worth the cost.
This isn’t about better slide decks or tighter ROI calculations. This is about whether you built the feedback instrumentation to measure business impact from day one, and whether you have the vocabulary to translate technical capability into CFO-legible outcomes before anyone asks. Most data PMs treat budget defense as a fourth-quarter event. The ones who keep their funding treat it as continuous product instrumentation. See also: how coaching culture strengthens budget arguments.
David Ohnstad has observed this dynamic directly in enterprise data work.
Why Data Product Value Conversations Fail Before They Start
Finance speaks in opportunity cost. Engineering speaks in technical debt reduction. Business stakeholders speak in time saved or decisions accelerated. Data product managers get caught in the translation gap — defending platform capabilities to people who don’t care about pipelines, defending usage metrics to CFOs who want to know why this costs more than the SaaS alternative they saw at a conference last month.
The core failure is this: most data product teams measure the wrong proxy variables. They track dashboard logins, query volumes, API calls — lagging indicators that show usage but not impact. When budget conversations arrive, they present graphs of adoption that look impressive until someone asks the obvious question: “What decision changed because of this data product that wouldn’t have changed otherwise?” And the room goes quiet.
According to McKinsey’s 2023 Analytics Impact Study, only 23% of enterprises could quantify a direct business outcome tied to a specific data product investment within 90 days of launch. The other 77% reported usage metrics, satisfaction scores, or technical performance SLAs — none of which answer whether the product justified its cost. The gap isn’t in the data product’s capability. The gap is in how value gets instrumented, measured, and communicated from the first sprint.
Here’s what makes this especially painful: the best-performing data products often have the weakest budget defense cases. A data product that becomes invisible infrastructure — deeply embedded, relied upon daily, never breaking — stops generating the visible wins that executives remember during planning season. The product that’s perpetually half-broken and requires weekly firefighting gets more executive attention because the pain of its absence is constantly visible. Budget re
David Ohnstad has observed this dynamic directly in enterprise data work.
newals reward visibility, not stability. That’s backwards, but it’s reality.
The Pre-Budget Value Instrumentation Model
This is a four-stage process that starts before the first line of code gets written and runs continuously through the product lifecycle. Each stage builds the evidentiary foundation that budget conversations require. Skip any stage and you’re defending retrospectively instead of proving proactively.
Stage 1: Decision Mapping Before Development — Before sprint zero, identify the three most expensive decisions this data product will influence and document the current cost of making those decisions poorly. Not hypothetical value. Actual cost. How long does the decision take now? How often does it get revisited because the data wasn’t clear? What does one wrong decision cost in lost opportunity, rework, or customer churn? This becomes your value ceiling. If your data product can’t measurably improve at least one of these high-cost decisions, don’t build it — you will not survive budget review.
Stage 2: Leading Indicator Selection — Pick two leading indicators that predict whether the decision quality is improving, measurable within 30 days of launch. Lagging indicators like “revenue influenced” take quarters to prove. Leading indicators like “time from question to confident answer” or “percentage of decisions made without escalation” show value immediately. The best leading indicator I’ve seen: reduction in repeat analysis requests. If stakeholders ask the same question three times, the data product didn’t answer it. If they ask once and move forward, it did. That’s measurable weekly.
Stage 3: Baseline Documentation — Two weeks before launch, document the current state with painful specificity. How long does the decision take today? How many people are involved? What’s the error rate? What’s the stakeholder confidence score? This is not a feel-good exercise. This is the control group. When budget season arrives and someone asks “How do we know this made a difference?”, you need the before-state documented by someone other than your team. Get a business stakeholder to sign off on the baseline. Their name on the measurement makes it credible.
Stage 4: Continuous Value Logging — Instrument the product to capture decision velocity, not just usage. Who used the data product is less valuable than what decision they made faster because of it. Build lightweight feedback loops: a single-question survey after every dashboard interaction (“Did this data change your next action? Yes / No / Still deciding”), a Slack integration that logs when someone references the data product in a decision thread, a quarterly stakeholder interview that asks “What decision would you have made differently without this?” These inputs feed the budget narrative. Without them, you’re guessing.
Most data product teams resist this model because it feels like overhead. It is overhead. It’s also the difference between renewing your budget and explaining to your team why the platform they built is getting deprecated. The teams that survive budget cuts are the ones who treated value measurement as a product feature from day one, not a retrospective justification exercise.
The ARR-Guardian Case Study: Measuring Impact When the Product Becomes Infrastructure
At Veeam, we built a renewal risk scoring model that integrated into the customer success platform. Technical execution was clean: sub-200ms query response, 94% prediction accuracy on 90-day renewal likelihood, full audit trail for compliance. Usage was high: CS team accessed it daily, account reviews referenced it consistently. But six months in, we faced a budget reallocation conversation. Another team wanted our headcount for a customer-facing feature with more visible impact.
We survived that conversation because we had instrumented decision velocity from week one. We tracked how long account reviews took before and after the model went live. Average review duration dropped from 47 minutes to 22 minutes. We tracked escalation rates: how often did a CS manager need to pull in a director to make a renewal decision? That dropped 38% in the first quarter. We tracked decision confidence: post-review surveys asked “How confident are you in the recommended action?” Confidence scores above 8/10 went from 54% to 81%.
But the number that saved the budget was opportunity cost. We calculated how many additional accounts the CS team could now review per quarter with the time saved. At an average account value of $47K annually, the incremental coverage was worth $1.2M in at-risk ARR that previously wouldn’t have gotten proactive attention. That number — $1.2M in coverage expansion — was the budget defense. Not prediction accuracy. Not usage stats. Not stakeholder satisfaction. The delta between what decisions could be made before and after.
The model became invisible infrastructure within nine months. Nobody talked about it. It just worked. That’s usually the death sentence for budget renewal. But because we had logged decision velocity and opportunity cost continuously, we had a value narrative that didn’t depend on executive memory or visible heroics. When finance asked why we needed to maintain this investment, we showed them a spreadsheet of incremental ARR coverage that would disappear if the product went away. Budget approved. The lesson: measure the absence cost, not just the presence value.
Stop Measuring Adoption — It Tracks Visibility, Not Value
Here’s the contrarian position that gets me into arguments with other data PMs: adoption metrics are a trap. High adoption of a low-value data product is worse than low adoption of a high-value one, but most teams celebrate the former and panic about the latter. Adoption measures how often people interact with the product. It does not measure whether those interactions produced better outcomes.
I worked with a team that built a real-time sales dashboard used by 200 people daily. Adoption looked great. Budget got cut anyway. Why? Because when finance asked what decisions changed, the sales VP admitted the dashboard was “nice to have” but didn’t influence pipeline prioritization. High usage of a low-stakes product is a budget risk. Conversely, I’ve seen a data product used by exactly seven people — senior finance analysts — that survived three rounds of budget cuts because those seven people made capital allocation decisions worth $80M annually, and they couldn’t do their job without it.
Adoption is a leading indicator of engagement. It is not a proxy for impact. The most dangerous thing a data PM can do is present a usage graph to a CFO and assume it speaks for itself. It doesn’t. Usage without outcome articulation reads as “people clicked on things.” That’s not a budget defense. That’s a vanity metric.
According to Forrester’s 2024 Data Strategy Report, enterprises that tied data product funding to outcome metrics (decision speed, error reduction, opportunity cost avoidance) had 3.2x higher budget renewal rates than those defending based on adoption and satisfaction scores. The shift is straightforward: stop measuring whether people used the product, start measuring whether the product made expensive decisions less expensive.
Building the Budget Narrative Before Budget Season Starts
The budget defense narrative doesn’t start when finance sends the Q4 planning template. It starts in the first sprint retrospective when you document what stakeholders expected to change and what actually changed. Every quarter, assemble a lightweight value log: three decisions that moved faster, two decisions that didn’t need escalation, one decision that would have gone wrong without the data product. These don’t need to be massive wins. They need to be specific and attributable.
The format that works: stakeholder name, decision context, time delta or cost delta, their words. Example: “Sarah Martinez, Regional Sales Director — needed to reallocate Q3 territory coverage. Before: 11 days to pull pipeline data and model scenarios. After: 2 days using the territory planning model. Her quote: ‘We reallocated two weeks earlier than we could have last year, which gave the team time to adjust before end-of-quarter.’ Value: earlier reallocation likely prevented $120K in missed quota.” That’s a budget narrative building block.
Collect four to six of these per quarter. By the time budget season arrives, you have 16-24 concrete examples of decisions that got better because the data product exists. That’s not a slide deck exercise. That’s evidence. When someone asks “What happens if we cut this?”, you have a specific answer: these 20 decisions revert to the old speed, cost, and error rate. Do you want that? Most executives don’t. But they need the specificity to understand what they’re risking.
David Ohnstad has watched too many strong data products get cut because the PM assumed the value was obvious. It’s never obvious. The product that survives budget scrutiny is the one where the PM treated value documentation as a weekly discipline, not a quarterly scramble. Building that discipline requires acknowledging that your job isn’t just shipping features — it’s continuously proving why the features justify their cost.
This intersects directly with how AI and enterprise SaaS products are evaluated during procurement cycles — where stakeholder alignment and outcome articulation often matter more than technical capability. Similarly, understanding leadership and career growth strategies helps PMs navigate the internal mobility dynamics that can disrupt roadmap continuity during budget planning season, especially when key team members transition to new roles mid-cycle.
The Federated Ownership Trade-Off: When Distributed Accountability Kills Budget Clarity
Federated data architectures promise distributed ownership and domain-aligned accountability. They also create a budget defense nightmare: when five teams co-own a data platform, who defends its value during budget cuts? The answer is usually “nobody clearly,” which is how platforms get deprecated despite delivering real value. Distributed ownership works for technical execution. It fails catastrophically for budget justification unless one PM owns the synthesis narrative.
David Ohnstad has seen this pattern repeatedly: a federated data platform where each domain team instruments their own value metrics, but nobody aggregates the total impact story. Finance sees six separate small investments, not one coherent capability. When budget pressure hits, each small investment looks cuttable. The aggregate value — visible only when you add up all the domain impacts — never gets presented because no single owner felt responsible for the cross-domain story.
The fix is assigning one PM — not necessarily the most senior, but the one with the best finance relationships — to own the aggregate value narrative. That PM’s job isn’t technical coordination. It’s collecting the decision-impact stories from every domain team quarterly and building the unified budget case. This doesn’t centralize architecture. It centralizes narrative. Without it, federated platforms are structurally vulnerable during budget season regardless of their technical success. For more on why this organizational design creates hidden failure modes, see the pillar content on federated data architectures and PM accountability gaps.
How do you measure data product ROI before revenue impact is visible?
Focus on leading indicators tied to decision velocity: time from question to answer, reduction in repeat analysis requests, percentage of decisions made without escalation, and stakeholder confidence scores. These predict value within 30 days of launch, while revenue impact can take quarters to materialize and is often influenced by variables outside the data product’s control.
What is the difference between adoption metrics and impact metrics for data products?
Adoption metrics track usage frequency — logins, queries, dashboard views. Impact metrics track decision outcomes — time saved, error reduction, confidence improvement, opportunity cost avoided. High adoption of a low-stakes product is a budget risk. Low adoption of a high-impact product used by key decision-makers often survives cuts. Impact matters more than visibility.
Why do data product budgets get cut even when usage metrics look strong?
Because usage doesn’t prove value — it proves engagement. When finance asks what decision changed or what cost was avoided, usage graphs don’t answer the question. Budgets survive when PMs can articulate specific decisions that moved faster, cost less, or had higher confidence because the product existed. Without that causal link, high usage reads as “people clicked things,” not impact.
What to Do Before Your Next Budget Cycle Starts
Two explicit actions — one for practitioners, one for leaders. If you’re a data PM, start a value log this week. Create a lightweight document with four columns: stakeholder name, decision context, measurable delta (time or cost), their quote. Add one entry per week. In 12 weeks you have a budget narrative. In 24 weeks you have a defensible track record that doesn’t depend on executive memory. This isn’t extra work — this is the work. If you can’t name the decisions your product improved, you’re building a feature, not a product.
If you’re leading a data product organization, audit whether your team has the instrumentation to answer the budget question before it gets asked. Can every PM on your team name three high-cost decisions their product influences and show a measurable delta within 90 days of launch? If not, budget season will be reactive and defensive. Value articulation isn’t a communication skill. It’s a product design discipline. Build it into sprint planning, retrospectives, and quarterly reviews. The teams that treat it as optional are the ones explaining to their engineers why the platform they built is getting deprecated.
Here’s the question to sit with: if your CFO asked you today, “What decision would cost us more to make if your data product disappeared tomorrow?”, could you answer in one sentence with a number attached? If not, you’re not done building the product. You’re missing the instrumentation layer that proves it was worth building. For more on navigating the compensation side of these budget and value conversations, see the discussion on data product manager salary negotiation and the analysis of data product manager compensation structures that reflect outcome accountability.
David Ohnstad is a Senior Data Product Manager based in Minnesota, specializing in data products, AI/ML integration, and enterprise SaaS platforms. Connect on LinkedIn or read more at davidohnstad.com.
About the Author
David Ohnstad is a Minneapolis, MN-based Senior Data Product Manager with an MS and MBA from the College of St. Scholastica. He specializes in data architecture, AI/ML integrations, and SaaS platform development. Outside work, he builds furniture and explores the Minnesota outdoors. Find his work at davidohnstad.com and github.com/davidohnstad40-netizen.
