# Data Products vs Analytics Dashboards: Why Most Teams Can’t Tell the Difference
The Dashboard Masquerade: Why $4M in “Data Product” Investment Actually Built Reporting Infrastructure
A Fortune 500 retail company announced a $4 million data product initiative in early 2024. Eighteen months later, they had eleven Tableau dashboards, three Snowflake schemas, and a team of five analysts maintaining nightly refreshes. When the CFO asked which data products were generating measurable business value, the silence lasted long enough to be uncomfortable. According to Gartner’s 2024 State of Data and Analytics report, 73% of enterprise “data product” initiatives are actually analytics infrastructure projects with better branding—and leadership doesn’t realize it until budget renewal season.
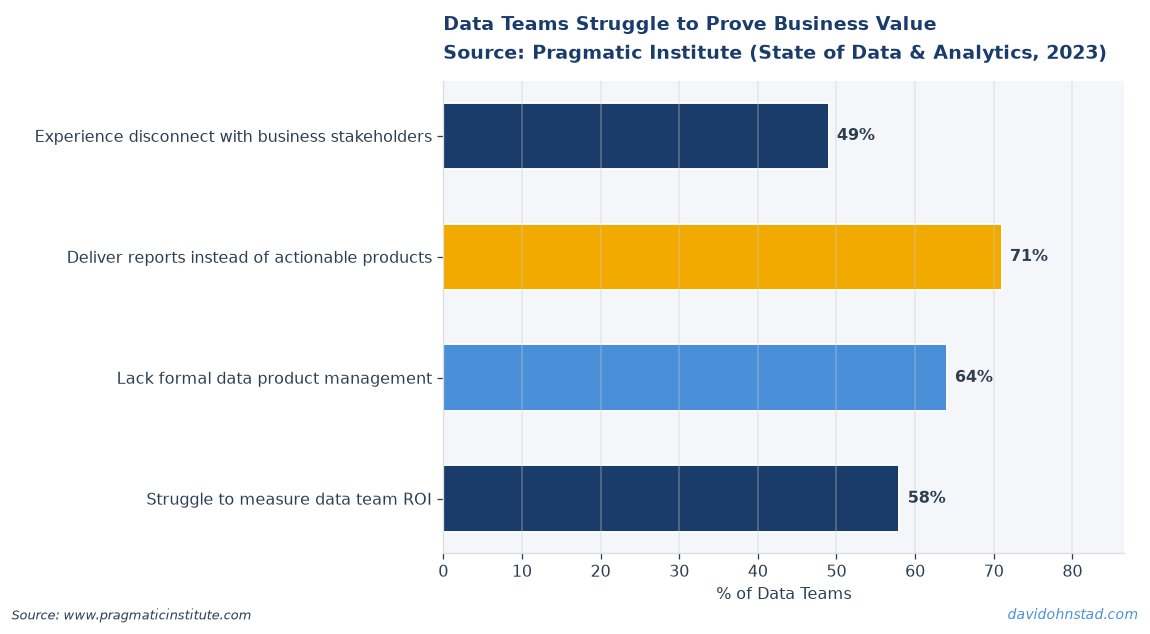
The confusion isn’t semantic. It’s structural. Analytics dashboards and data products serve fundamentally different purposes, create value through different mechanisms, and fail in different ways. But because both involve data, pipelines, and visual interfaces, teams treat them as evolutionary stages of the same thing: analytics 1.0 becomes a data product when you add governance, SLAs, and a product manager. That’s like saying a bicycle becomes a car when you add better brakes.
This distinction matters more now than it did two years ago. With dbt Coalesce happening in five days and Q4 budget conversations already underway, data leaders are being asked to justify headcount, platform spend, and team structure for “data product” work. If you can’t articulate what separates a data product from a dashboard—with specific examples, not metaphors—you’re asking for analytics budget with product-tier pricing. The math doesn’t work, and your CFO knows it.
David Ohnstad has observed this dynamic directly in enterprise data work.
What Actually Breaks When You Confuse the Two
The failure mode isn’t that dashboards are bad. The failure mode is resource misallocation at scale. When a team receives data product funding but builds analytics infrastructure, three specific problems compound over time: engineering gets staffed for the wrong skills, success metrics measure the wrong outcomes, and opportunity cost becomes invisible until a competitor ships something you can’t replicate with Looker.
David Ohnstad saw this firsthand at Veeam when a cross-functional team proposed a “customer health data product” in Q2 2024. The initial spec included predictive churn scoring, automated intervention triggers, and an API for the customer success platform to consume risk signals in real time. The actual deliverable six months later was a Tableau dashboard showing lagging indicators of support ticket volume, login frequency, and license utilization—metrics the CS team already tracked manually in spreadsheets. Nobody lied. The requirements document said “data product.” The team genuinely believed they were building one. But every design decision optimized for human consumption, not programmatic integration.
The financial impact was measurable. The analytics dashboard cost $180,000 in engineering and analyst time, required ongoing maintenance from two full-time roles, and served fourteen users. A true data product—risk scores exposed via API—would have served the same fourteen users plus automated playbooks, triggered Salesforce workflows, and enabled the customer success platform to route high-risk accounts without human triage. The ROI calculation for the dashboard tracked report adoption. The ROI calculation for the data product would have tracked intervention velocity and prevented churn. Same budget. Different outcomes. The business case broke because leadership approved funding for the second thing and received the first.
This isn’t a unique story. According to Forrester’s 2025 Data Strategy Survey, 64% of organizations that claim to have “operationalized data products” cannot name a single system that consumes their data product outputs programmatically. They have consumers who look at outputs. That’s analytics. The distinction is whether downstream systems act on the data without human interpretation in the loop.
The Consumption Model Diagnostic: A Three-Part Test for Identifying Real Data Products
Here’s the framework David Ohnstad uses when a stakeholder asks whether something qualifies as a data product or remains an analytics asset. It’s a three-question diagnostic that focuses on consumption patterns, not delivery infrastructure. Call it the Consumption Model Diagnostic. If you can’t answer yes to at least two of these three questions, you’re building analytics—and that’s fine, as long as you’re honest about it when requesting budget and headcount.
Question one: Does a system consume this output programmatically? Not a person looking at a chart. Not a person downloading a CSV and uploading it somewhere else. A system making a decision or taking an action based on the data without human intervention. Examples that count: an API returning a credit risk score that a loan approval workflow consumes, a machine learning feature store that serves model inputs in production, a real-time pricing engine that adjusts offers based on inventory and demand signals. Examples that don’t count: a dashboard that shows credit risk scores for human review, a weekly email with model performance metrics, a report that helps pricing analysts decide what to charge. The presence of a human in the decision loop disqualifies it.
Question two: Would breaking this output cause a system failure, not just a reporting gap? If the data stops flowing, does something stop working—or do people just stop seeing updates? When Veeam’s backup success prediction model went down for four hours in mid-2025, automated remediation workflows in customer environments stopped triggering. That’s a system failure. When a utilization dashboard goes down for four hours, analysts complain in Slack and check again after lunch. That’s a reporting gap. Data products sit in the critical path of operational systems. Analytics sits in the critical path of human understanding. Both matter. They’re not the same thing.
Question three: Is there a feedback loop where consumption behavior improves the product? Real products get better as they’re used. A recommendation engine learns from click-through behavior. A fraud detection model retrains on labeled transaction outcomes. A demand forecasting service adjusts based on actual fulfillment data. Analytics dashboards don’t have this property—adding more users doesn’t make the chart more accurate. You can build feedback loops into analytics (user surveys, adoption tracking), but those measure satisfaction with the delivery mechanism, not improvement in the underlying output quality. Data products have a reinforcement learning characteristic that analytics fundamentally lacks. Use improves performance. That’s a product behavior.
Apply this diagnostic to your current portfolio. Most teams discover that 80% of what they call data products are actually analytics with good engineering practices—versioned datasets, automated pipelines, SLA monitoring. Those things are valuable. They’re table stakes for analytics that doesn’t break constantly. But they don’t convert analytics into a product. A reliable dashboard is still a dashboard.
Why the Industry Keeps Getting This Wrong: Incentives and Legacy Mental Models
The confusion persists because three forces push teams toward mislabeling analytics as products: vendor positioning, hiring incentives, and the legacy career ladder that emerged from business intelligence roles. Each force is rational in isolation. Together, they create systematic misclassification that makes honest budgeting almost impossible.
Vendor positioning is the most visible force. Every major analytics platform added “data product” language to their marketing in 2023-2024 because customers started asking for it. Tableau promoted “governed data products” that are actually curated datasets with row-level security. Looker repositioned its semantic layer as “productized metrics” when the underlying functionality is a centralized definition library. These aren’t lies—they’re feature sets described with product framing because “better dashboard governance” doesn’t justify a platform migration. The vendors aren’t confused. They’re responding to what buyers are asking for. But when a Tableau sales deck calls governed datasets “data products,” teams who buy Tableau absorb that framing and apply it internally.
Hiring incentives make the problem structural. A Data Product Manager role commands $140,000 to $180,000 in most markets, according to Dice’s 2025 Tech Salary Report. An Analytics Manager role in the same company averages $110,000 to $135,000. If you’re building analytics infrastructure but staff it with product managers, you’re paying a 25-35% wage premium for skills the work doesn’t require. But if you’re genuinely building data products and staff it with analytics managers who’ve never shipped an API or managed a feature backlog, you’ll fail differently—delivering reports when the business needed embedded intelligence. The role definitions are porous enough that companies often don’t realize they’ve made the wrong hire until nine months in, when a product roadmap looks suspiciously like a BI reporting backlog.
The legacy mental model is hardest to displace because it’s embedded in how data teams evolved. Most data product managers came up through analytics roles—building dashboards, running SQL, designing dimensional models. That’s David Ohnstad’s background too. The instinct when asked to “build a data product” is to build what you know how to build well, with better process. That produces highly governed, version-controlled, SLA-backed analytics. It doesn’t produce products. Making the leap requires unlearning the assumption that better analytics infrastructure is the same thing as product development. It’s not. Analytics projects fail when data is wrong or nobody uses the dashboard. Data products fail when the API contract breaks, the latency exceeds downstream tolerance, or the model predictions degrade below the accuracy threshold that automated decisions require. These are different failure modes requiring different skills.
Here’s the contrarian claim most senior data leaders will resist: Stop hiring “data product managers” to fix your analytics delivery problems—they’ll build products you don’t need while your reporting backlog grows. If the actual work is “deliver accurate, governed dashboards faster,” hire analytics engineers and give them a prioritization framework. If the actual work is “expose data capabilities that other systems consume programmatically,” hire product managers with API experience and accept that you’ll deliver fewer dashboards. Trying to do both with the same headcount and calling everything “data products” is why salary expectations are disconnected from actual role responsibilities and why Q4 budget conversations devolve into arguments about terminology instead of value delivery.
Five Myths That Persist in the SERP and Conference Talks
Myth one: A data product is just analytics with an SLA. This is the most common misconception in practitioner content. The argument goes: if you add data quality monitoring, uptime guarantees, and on-call rotation to a dashboard, it becomes a product. This confuses operational rigor with product definition. An SLA describes how reliably something is delivered. It doesn’t change what is being delivered. A dashboard with 99.9% uptime is a highly reliable dashboard. It’s not a product unless something other than a human depends on that uptime. Reliability is necessary for data products—nobody builds an API with no uptime commitment—but it’s not sufficient to transform analytics into a product.
Myth two: Data products must include machine learning. The inverse misconception: if it doesn’t have a model, it’s not a data product. This eliminates entire categories of legitimate data products—feature stores, master data APIs, event streams, reference data services—that provide structured, consumable data without predictive logic. Machine learning models are often data products, but the defining characteristic is programmatic consumption and system integration, not statistical methodology. A rules-based scoring engine exposed via API is more of a data product than a machine learning model whose predictions are displayed in a dashboard for human review. The presence of ML is orthogonal to the product question.
Myth three: Self-service analytics is a data product. This framing appears in almost every “what is a data product” article on Medium and in vendor content. The argument: if business users can explore data without bothering analysts, you’ve productized your analytics. But self-service describes the access model, not the consumption pattern. Giving more people access to dashboards doesn’t change the fact that humans are still the consumers. A self-service analytics platform is infrastructure that enables analytics delivery at scale. It’s valuable. It’s not a product in the sense that an API or embedded feature is a product. Nobody wakes up on Monday and decides to “buy” access to your Looker instance the way they’d adopt a fraud detection API. They’re granted access by IT. That’s not product adoption. That’s provisioning.
Myth four: If you charge for it, it’s a product. Cost recovery doesn’t equal product status. Plenty of IT organizations implement chargeback models for analytics infrastructure—business units pay based on compute usage, storage footprint, or report volume. This creates accountability and aligns incentives, but it doesn’t convert the deliverable into a product. A product has users who choose to adopt it because it solves a problem better than alternatives. Chargeback-funded analytics has consumers who are required to use it because the company mandated a standard reporting platform. The presence of a price signal is necessary for external-facing data products (you’re selling access to data or insights). It’s not sufficient for internal-facing data capabilities unless adoption is genuinely optional and competitive with outside alternatives.
Myth five: Data mesh equals data products. The data mesh architecture treats datasets as products, assigns ownership, and emphasizes domain-driven design. This is closer to true product thinking than traditional centralized BI, but it’s still not the same thing as data products in the programmatic sense. A well-governed domain dataset with clear ownership and SLAs is a high-quality analytics asset. If it’s consumed exclusively by dashboards and analysts writing SQL, it’s not a product—it’s a productized data asset, which is a different concept. The confusion happens because data mesh literature uses “product thinking” to describe governance discipline, ownership accountability, and user empathy. Those are product management skills applied to data delivery. They don’t automatically result in products that systems consume programmatically. You can run a data mesh and still deliver only analytics. You can also build real data products without a mesh architecture. The two concepts overlap but aren’t synonymous.
What This Means for dbt Coalesce and Q4 Planning
If you’re headed to dbt Coalesce this week, watch how speakers describe their “data products.” Count how many examples involve downstream systems consuming outputs programmatically versus how many examples involve humans looking at better-organized data. The ratio will tell you whether the data community has converged on a shared definition or whether we’re still in the “everything is a data product if you govern it well” phase. Based on CFP session titles published in early September, most talks are still focused on analytics delivery—how to build reliable metrics, how to implement semantic layers, how to scale transformations. Those are critical problems. They’re not product development problems. They’re data engineering and analytics engineering problems.
For Q4 budget planning, this distinction determines whether your headcount request gets approved. If you ask for data product managers and describe analytics deliverables in the business case, finance will either cut the budget (you’re asking for expensive resources to do cheaper work) or approve it and then wonder why dashboards cost $180,000 per analyst. If you ask for analytics engineers and describe actual data product deliverables in the business case, you’ll get rejected for under-resourcing the work. The fix is to separate the asks: request analytics resources for analytics work, request product resources for product work, and accept that you may need different team structures and leadership approaches for each. Trying to run both out of one team with one budget line is how you end up with $4 million spent and eleven dashboards to show for it.
Two explicit takeaways—one for practitioners, one for leaders. Practitioners: audit your current roadmap and tag every item as “analytics” or “product” using the three-question diagnostic earlier in this article. If everything is tagged “product” but nothing has programmatic consumers, you’re mislabeling. Relabel honestly, then decide whether that’s a problem. Sometimes the right answer is to build great analytics and stop calling it product development. Leaders: the next time someone proposes a “data product” initiative, ask them to name three systems that will consume the output without human intervention. If they can’t, you’re funding analytics with product pricing. Adjust scope or budget accordingly.
What’s the difference between a data product and an analytics dashboard?
A data product is consumed programmatically by other systems—like an API serving fraud scores to a payment processor—while an analytics dashboard is consumed by humans who interpret the data and then take action. The distinction is whether downstream decisions happen automatically or require human review in the loop.
How do you know if your data product is actually just analytics with good engineering?
Apply the Consumption Model Diagnostic: Does a system consume this programmatically? Would breaking it cause a system failure, not just a reporting gap? Is there a feedback loop where usage improves performance? If you can’t answer yes to at least two, it’s analytics with operational rigor, not a product.
Why do companies keep mislabeling analytics projects as data products?
Three forces drive the confusion: vendor marketing repositioned analytics platforms as “data product” tools, hiring incentives reward teams for using product titles even when doing analytics work, and legacy career paths train data leaders in dashboard delivery rather than API-first product development. Honest budgeting requires separating the two.
When was the last time you checked whether your “data products” are actually changing system behavior—or just providing humans with better reports? If the answer involves a dashboard, you know what work remains.
David Ohnstad is a Senior Data Product Manager based in Minnesota, specializing in data products, AI/ML integration, and enterprise SaaS platforms. Connect on LinkedIn or read more at davidohnstad.com.
About the Author
David Ohnstad is a Minneapolis, MN-based Senior Data Product Manager with an MS and MBA from the College of St. Scholastica. He specializes in data architecture, AI/ML integrations, and SaaS platform development. Outside work, he builds furniture and explores the Minnesota outdoors. Find his work at davidohnstad.com and github.com/davidohnstad40-netizen.
