
Why Data Product Budgets Get Cut: The ROI Measurement Gap
We spent $380,000 on a data platform rebuild. Usage metrics looked strong: 142 active users in month three, 89% uptime, query response times under 2 seconds. Six months later, finance killed the budget renewal. Not because the platform failed—because we couldn’t answer whether it changed a single business decision. According to Gartner’s 2024 Analytics and Business Intelligence Survey, 68% of data and analytics leaders report difficulty demonstrating business value to executive stakeholders, and 54% face budget scrutiny specifically because they lack clear ROI measurement frameworks.
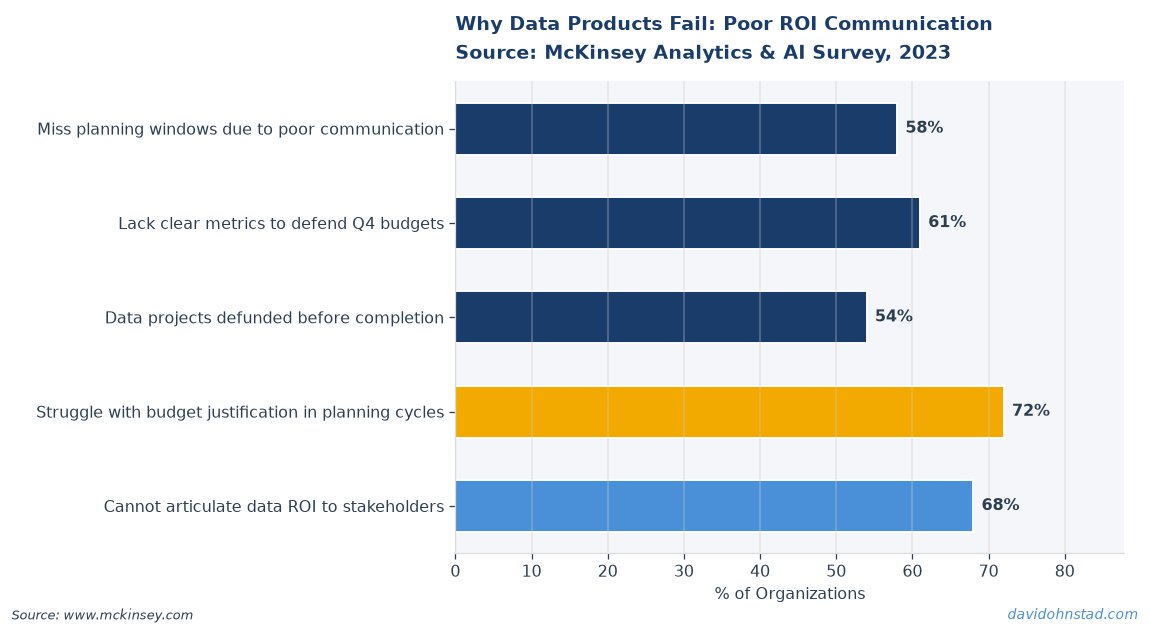
That gap isn’t a data problem. It’s a language problem. Data product managers speak in adoption curves and system reliability. CFOs speak in margin improvement and opportunity cost. When finance asks why the data platform costs $400K but dashboards still break, most data PMs hand over usage statistics and hope those numbers translate to value. They don’t.
Q3 close forces this conversation into the open. Every non-revenue platform investment gets scrutinized. Data teams that can’t articulate ROI in CFO-legible terms lose budget to teams that can—even when the data product delivers more strategic value.
What Gets Measured Versus What Actually Matters
The standard data product health metrics are usage rate, query volume, and uptime. These measure activity, not impact. A dashboard with 200 weekly active users tells you nothing about whether those users made better decisions, moved faster, or avoided costly mistakes. McKinsey’s 2023 State of AI report found that organizations measuring only technical performance metrics were 3.2 times less likely to capture measurable business value from analytics investments compared to those tracking decision velocity and outcome changes.
Activity metrics create false confidence. David Ohnstad has watched teams celebrate 85% adoption while the product generated zero net new revenue and didn’t prevent a single escalation. The dashboard existed. People opened it. Nothing changed. Finance saw the cost line; they didn’t see the value line because there wasn’t one to show.
The root issue: leading indicators for data product manager success don’t map to lagging indicators for business impact. Usage predicts engagement. It doesn’t predict whether engagement drove margin improvement, reduced time-to-decision, or decreased operational risk. Those are the metrics finance cares about during budget season.
Most data PMs over-index on what’s easy to instrument—logins, queries, session duration—and under-index on what’s hard: time saved, decisions accelerated, losses prevented. That trade-off makes the data product vulnerable when budget conversations shift from “is this working?” to “what would we lose if we cut this?”
The Value Translation Framework: From Activity to Business Outcome
The problem isn’t that data products lack value. It’s that value stays trapped in technical metrics that don’t cross the finance translation barrier. The framework David Ohnstad uses to defend data product budgets has four layers, and each one requires instrumentation before budget season starts—not during the renewal meeting when it’s too late.
Layer 1: Measure Decision Velocity, Not Dashboard Opens. Track how long it takes a user to move from data access to decision execution. A procurement team that used to spend four days gathering supplier performance data now does it in 90 minutes because the data product surfaces it automatically. That’s 26.5 hours saved per decision cycle. Multiply by decision frequency. That’s the ROI numerator finance understands. Most data PMs stop at “the dashboard was used 47 times this quarter” and wonder why budget gets cut.
Layer 2: Instrument Opportunity Cost Avoidance. Every data product prevents manual work, rework, or delayed decisions. None of that shows up in adoption metrics. If the data product flags inventory discrepancies before month-end close, it prevents a scramble that used to require six people working a weekend. That’s 96 hours of avoided labor cost, plus the operational risk mitigation of catching the error before it hits the financials. Document what the organization would have spent if the data product didn’t exist. That’s the cost baseline your ROI calculation needs.
Layer 3: Track Leading Indicators That Predict Lagging Outcomes. Usage alone doesn’t predict value, but usage combined with specific user actions does. If procurement opens the supplier dashboard and then executes a contract negotiation within 48 hours, that correlation becomes predictive. Forrester’s 2024 Data Strategy Playbook found that organizations tracking decision-linked usage patterns—not just raw usage—reported 41% higher confidence in their ability to demonstrate ROI to finance stakeholders. Build the instrumentation to capture which user actions immediately follow data product engagement. That gives you the evidence trail when finance asks whether the product actually drives outcomes.
Layer 4: Quantify Baseline Degradation Without the Product. The most defensible ROI argument isn’t what the product enables—it’s what breaks if you remove it. During one budget defense conversation, David Ohnstad documented that eliminating the data product would force the sales ops team back to weekly manual reporting, increasing report delivery time from 30 minutes to 11 hours per cycle. That delay meant sales leaders made territory adjustments based on week-old data instead of near-real-time insights. The cost wasn’t the 10.5 hours of labor. It was the margin loss from delayed territory rebalancing during a peak sales quarter. Finance approved the renewal because the alternative was quantified as direct revenue risk.
This framework only works if instrumented before budget conversations start. You cannot retroactively build the ROI case during the Q4 planning cycle if you haven’t been capturing the value metrics all year. That’s the failure mode most data teams hit: great product, no ROI story, budget cut anyway.
How AI Procurement Costs Complicate Data Product ROI
AI/ML engineering teams often underestimate the procurement and stakeholder alignment costs that data PMs must defend during budget cycles, making technical capability alone insufficient for enterprise approval. A recommendation engine that improves click-through by 18% sounds like a win until finance sees the $240K annual spend on model infrastructure, the three-month integration timeline that delayed other roadmap work, and the fact that click-through improvement didn’t translate to measurable purchase conversion lift.
The procurement layer adds cost without adding legible value unless the data PM builds the instrumentation to connect AI feature usage to business outcomes. According to Deloitte’s 2024 State of AI in the Enterprise report, 62% of AI projects face budget challenges due to unclear ROI articulation, and 47% of finance leaders cite “inability to measure incremental value” as the primary barrier to continued AI investment. The technical win—model accuracy, latency improvement, feature adoption—doesn’t survive the budget renewal meeting if it can’t be translated into margin impact, cost avoidance, or risk reduction.
Data product managers who treat AI features as engineering deliverables instead of business investments set themselves up for budget cuts. The AI capability might be sound. The AI and enterprise SaaS architecture might be clean. But if the cost structure doesn’t map to a defensible ROI calculation, finance will kill the project before it scales. This gap between technical success and financial defensibility is where most enterprise AI initiatives stall—not because the models fail, but because the business case was never instrumented in CFO-legible terms.
When Leadership Transitions Break Data Product Continuity
Internal mobility planning directly impacts data product roadmap continuity when key PMs transition to leadership roles during budget season. A data product that had executive sponsorship in Q2 loses its champion in Q3 when that VP moves to a new division. The new leader inherits the budget line but not the context on why the investment mattered. Without documented ROI metrics that survive leadership transitions, the data product becomes an orphaned cost center.
David Ohnstad has seen this kill otherwise successful products. A customer analytics platform had strong adoption, clear business impact, and a roadmap aligned to corporate strategy. The VP who sponsored it took a new role in October. The replacement inherited the P&L and asked the obvious question: “What would we lose if we stopped funding this?” The data PM couldn’t answer with specifics because the ROI story lived in the previous VP’s head, not in documented metrics. Finance cut the budget by 60% in the next planning cycle.
The fix isn’t better stakeholder management. It’s building leadership and career growth transition resilience into the data product itself. Every data product needs a one-page ROI brief that updates quarterly: baseline cost without the product, measurable outcomes delivered, decision velocity improvements, opportunity cost avoidance. That document must be legible to a finance leader who has never used the product and doesn’t understand the technical architecture. If it requires the current PM or the current executive sponsor to explain, it won’t survive their departure.
This is especially critical in Q3 and Q4 when leadership transitions cluster around annual planning cycles. A data product without documented, executive-legible ROI metrics is one leadership change away from a budget cut, regardless of how well it performs.
Stop Measuring Engagement—Measure Time-to-Insight Instead
Most data product managers track the wrong proxy. Engagement metrics—dashboard views, query counts, session duration—measure whether people are using the product. They don’t measure whether the product makes people faster or better at their jobs. That distinction kills data products during budget season.
Time-to-insight measures how long it takes a user to go from “I have a question” to “I have an answer I trust enough to act on.” A finance analyst who used to spend six hours reconciling revenue data across three systems now does it in 45 minutes because the data product surfaces a unified view. That 5.25-hour reduction per cycle is the ROI number finance understands. Multiply by frequency: if the analyst does this twice a week, the data product saves 546 hours per year. At a $75/hour loaded cost, that’s $40,950 in annual labor cost avoidance—just for one user on one workflow.
Harvard Business Review’s 2023 analysis of analytics adoption found that organizations measuring time-to-insight reported 2.7 times higher ROI confidence scores compared to those measuring only usage-based engagement metrics. The metric shift changes the conversation. Engagement metrics prompt the question “Is anyone using this?” Time-to-insight metrics answer the question “Are we getting faster at making decisions because this exists?” The second question maps to business value. The first one doesn’t.
But most data PMs don’t instrument time-to-insight because it requires baseline measurement before the product ships. You need to know how long the workflow took before the data product existed. That means running a pre-launch time study on at least 10 representative users completing the task manually. Most teams skip this step because they’re focused on building the product, not measuring the problem. Then budget season arrives, finance asks “What did this actually improve?” and the data PM has usage stats but no before-and-after comparison. That’s the gap that gets budgets cut.
The Real Budget Defense: Document What Breaks If You Remove It
The strongest ROI argument for a data product isn’t what it enables—it’s what fails if you take it away. Finance approves investments that prevent measurable loss more readily than investments that promise speculative gain. A data product that prevents the sales ops team from spending 11 hours per week on manual reporting has a quantified cost of removal: 572 hours per year at $65/hour loaded cost equals $37,180 in direct labor, plus the operational risk of delayed reporting during peak sales cycles.
Most data PMs pitch the value of what the product delivers. That makes the conversation aspirational. Finance hears “This could help us make better decisions” and thinks “That’s not a line item I can defend.” The conversation needs to flip: “Without this product, our sales ops team reverts to manual reporting. That’s 11 additional hours per week. During Q4, that delay means territory rebalancing decisions lag by 9 days. Last year, delayed rebalancing in November cost us an estimated $240K in missed pipeline coverage. This product prevents that.”
That’s not a hypothetical benefit. It’s a documented cost of removal. Finance understands cost avoidance. They approve budgets to prevent loss. But you can only make this argument if you documented the baseline before building the product. If you didn’t measure the cost and time of the manual process before automation, you can’t credibly quantify what reappears if the product gets cut. That missing baseline is why most data products get deprioritized during budget scrutiny—not because they don’t deliver value, but because the PM never quantified what breaks without them.
Case Study: Building ROI Instrumentation Into the Product
One of the most defensible data products David Ohnstad built wasn’t technically sophisticated. It was a supplier performance dashboard for a procurement team managing 180+ vendor relationships. The technical stack was straightforward: SQL warehouse, automated ETL pipeline, Tableau front end. The ROI instrumentation made it un-cuttable during three consecutive budget cycles.
Before building the product, the team documented the baseline workflow. Procurement analysts spent an average of 4.2 hours per week manually pulling supplier data from three systems, reconciling discrepancies in spreadsheets, and generating performance reports for quarterly business reviews. That manual process introduced a 6-day lag between data extraction and report delivery, which meant contract renegotiation decisions were based on weeks-old performance data. During one high-stakes vendor review, the delayed data caused the team to miss a pricing anomaly that cost the company $38,000 before it was caught in the next cycle.
The data product reduced report generation time from 4.2 hours to 22 minutes. That’s a 94% time reduction. It also collapsed the reporting lag from 6 days to near-real-time, which meant procurement could spot pricing issues within 48 hours instead of weeks later. But those technical wins weren’t the ROI story. The ROI story was the cost baseline: without the product, the procurement team would revert to 218 hours of manual reporting labor per year at a $72/hour loaded cost, totaling $15,696 in direct cost. Add the operational risk mitigation—the $38K loss would not have been caught early without real-time data access—and the total annual value was $53,696 against a $41,000 build and annual maintenance cost.
That ROI brief survived two VP transitions and one finance-led zero-based budgeting exercise. It survived because the value didn’t live in David Ohnstad’s head or in usage metrics. It lived in a one-page document that quantified time saved, cost avoided, and loss prevented in terms a CFO could defend to a board. When budget scrutiny hit in Q3 of year two, the new procurement VP had never used the product but could explain exactly what would break if it got cut. Finance renewed the budget without negotiation.
The lesson isn’t that every data product needs a one-page ROI brief. It’s that every data product that matters enough to defend needs instrumentation that quantifies impact before budget season starts. If you wait until the renewal meeting to build the ROI case, you’re already too late. The baseline data, the time-to-insight metrics, and the cost-of-removal calculation need to be baked into the product from day one—not retrofitted when finance starts asking hard questions.
What to Instrument Before Budget Season Starts
Most data PMs treat ROI measurement as a post-launch reporting exercise. That’s why budget renewals turn into scrambles to find justification metrics after the fact. The instrumentation needs to be part of the product spec, not an afterthought. Here’s what to build in before the product ships.
Pre-launch baseline study. Document the current state: how long does the workflow take now, how many people are involved, what does delay or error cost the business? This is the denominator in every ROI calculation. Without it, you can’t credibly claim the product saved time or prevented cost because you don’t know what the starting point was. Most teams skip this because it feels like overhead during a sprint-heavy build cycle. That skipped step is why the ROI case falls apart six months later when finance asks “What did this actually improve?”
User action tracking post-engagement. Instrument what happens after a user accesses the data product. Did they execute a decision within 48 hours? Did they escalate an issue that wouldn’t have been visible without the product? Did they avoid rework because the data was accurate the first time? Usage alone tells you the product was opened. Action tracking tells you whether opening it mattered. This is the bridge metric between activity and outcome, and it’s the one most data products don’t capture.
Quarterly ROI brief. A living document that updates every quarter: baseline cost without the product, hours saved this quarter, decisions accelerated, errors prevented, total quantified value. This is the artifact that survives leadership transitions and budget scrutiny. It doesn’t require deep data literacy to understand. A finance VP who has never touched the product should be able to read the brief and explain to a board member why cutting the budget would cost more than keeping it. If the brief requires interpretation by the PM, it’s not defensible.
This instrumentation work feels like non-product overhead. It’s not. It’s the insurance policy that keeps the product funded when budget priorities shift. Data products with strong adoption but weak ROI documentation get cut during data product manager compensation reviews and budget reallocations. Data products with documented, CFO-legible ROI metrics survive leadership changes, finance scrutiny, and zero-based budgeting exercises. The difference isn’t the quality of the product. It’s whether the value story can be told by someone other than the person who built it.
How do you measure ROI for a data product?
Measure time saved, decisions accelerated, and costs avoided—not usage metrics. Document the baseline workflow before the product ships, then track how much faster users reach decisions and what errors or delays the product prevents. Quantify those improvements in labor cost and opportunity cost terms finance can defend. Usage tells you engagement; time-to-insight and cost avoidance tell you impact.
What is the difference between data product adoption and data product value?
Adoption measures whether people use the product. Value measures whether using it changes outcomes—faster decisions, fewer errors, avoided losses. High adoption with no outcome change means the product is accessed but not impactful. Finance cares about value, not activity. A dashboard with 200 users that doesn’t shorten decision cycles or prevent costly mistakes has adoption but no defensible ROI during budget renewal.
Why do data products get cut during budget planning?
Data products get cut because PMs measure activity instead of business impact. Usage stats don’t translate to CFO-legible ROI. When finance asks what would break if they removed the product, most data PMs can’t answer with quantified costs. Products that document time saved, loss prevented, and workflow degradation without them survive budget scrutiny. Those that only report logins and query counts don’t.
What Data PMs Should Be Asking Right Now
Budget season exposes whether your data product has a defensible ROI story or just impressive usage metrics. For practitioners, the takeaway is this: if you can’t quantify what breaks when the product disappears, you don’t have an ROI case—you have a wishlist. Instrumentation matters more than engagement. The product needs to capture time-to-insight, cost avoidance, and decision velocity from day one, not as a post-launch reporting layer.
For leaders, the question is whether your data product budget requests include baseline measurements and outcome instrumentation, or whether they pitch capability and hope finance translates that to value. The teams that survive budget cuts document what the organization would spend without the product—not what the product might enable in theory. That requires PMs to build ROI tracking into the product spec before the first sprint, not scramble for justification metrics when the renewal meeting lands on the calendar.
When did you last audit whether your most-used data product is actually shortening decision cycles—or just giving people another place to look at numbers before making the same call they would have made anyway?
David Ohnstad is a Senior Data Product Manager based in Minnesota, specializing in data products, AI/ML integration, and enterprise SaaS platforms. Connect on LinkedIn or read more at davidohnstad.com.
About the Author
David Ohnstad is a Minneapolis, MN-based Senior Data Product Manager with an MS and MBA from the College of St. Scholastica. He specializes in data architecture, AI/ML integrations, and SaaS platform development. Outside work, he builds furniture and explores the Minnesota outdoors. Find his work at davidohnstad.com and github.com/davidohnstad40-netizen.
