
Why Data Product Management Frameworks Exist—And Why Most Teams Ignore Them Until It’s Too Late
We built a customer health scoring model that took seven months, required three engineering sprints, and involved stakeholders from sales, support, and finance. The VP of Sales called it “exactly what we needed” at the demo. Four months after launch, usage sat at 11%. Not 11% growth—11% total adoption. The score updated daily in Salesforce, but reps kept using their gut feel and quarterly revenue trends instead. According to McKinsey’s 2023 State of AI report, 87% of data science and analytics projects never make it to production, and of those that do, fewer than half achieve measurable business impact within 18 months. We shipped. We still failed.
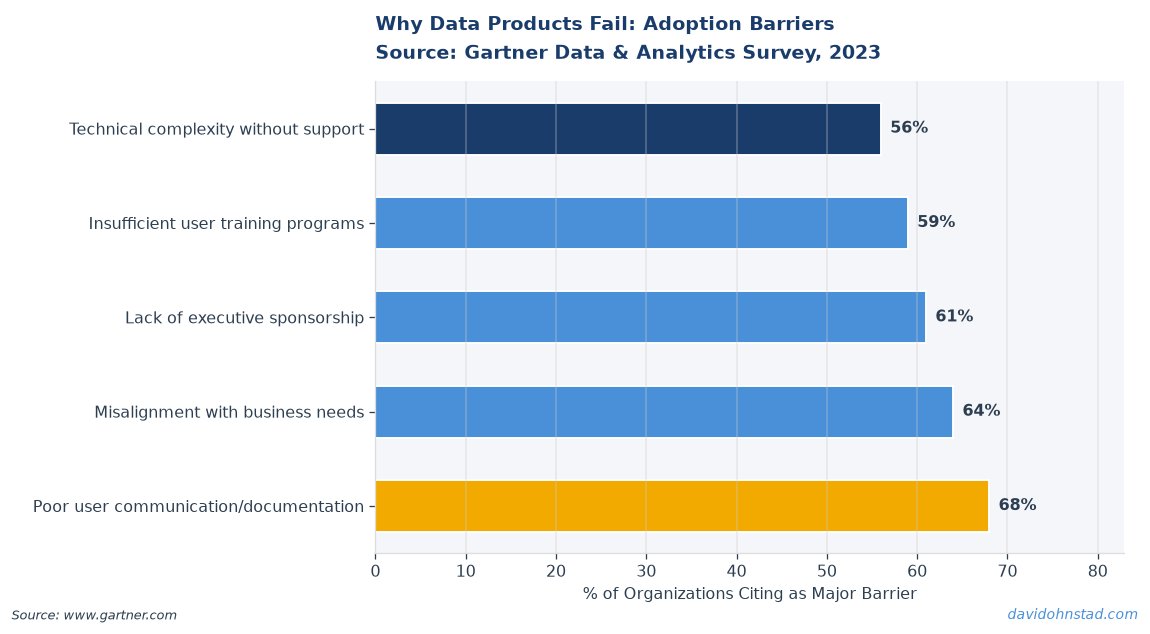
The problem wasn’t the model. The math was sound. The data pipeline ran clean. The issue was structural: nobody on the product team understood what framework to use when building a data product versus a feature product. We treated customer health scoring like we’d treat a UI redesign—ship it, track adoption, iterate. But data products don’t work that way. They require feedback loops before launch, not after. They need decision integration, not dashboard distribution. And most critically, they demand a different product management discipline entirely.
David Ohnstad has seen this pattern repeat across SaaS platforms, analytics tools, and enterprise data teams. The gap isn’t technical—it’s methodological. Teams that succeed with data products use frameworks. Teams that fail either skip frameworks entirely or apply software product frameworks to data problems. Those are not the same discipline, and the failure modes prove it.
What Breaks When You Skip the Framework
The most common failure mode is what I call “deployment theater”—the product ships, stakeholders applaud, and six months later nobody remembers it exists. Gartner’s 2024 Data & Analytics Leadership Survey found that 78% of enterprise data initiatives fail to move beyond pilot stage, and of those that do launch, median usage drops 60% within the first year. This isn’t a training problem or a change management gap. It’s a product management breakdown.
Consider what happened at a B2B SaaS company building predictive churn models. The data science team delivered an algorithm with 91% accuracy. Product management added it to the customer dashboard as a “churn risk score.” Sales and customer success teams received a one-hour training session. Three months later, usage metrics showed the score was viewed an average of 1.2 times per account—almost always during quarterly business reviews, never during active decision-making. The product didn’t fail because the prediction was wrong. It failed because nobody anchored the score to a specific workflow, a decision point, or a success metric that mattered to the people expected to use it.
That’s not a data problem. That’s a product management gap. And it’s entirely preventable if teams use a structured approach to building data products from the beginning. The challenge is that most product managers come from feature development backgrounds where the core loop is: define requirements, ship functionality, measure engagement, iterate. Data products require a different sequence: define the decision, validate the feedback loop, integrate the workflow, then build the data layer. Most teams reverse that order and wonder why adoption craters.
The Decision-Layer Framework: Building Data Products That Actually Get Used
This is a five-step framework that treats data products as decision enablers, not information publishers. The core insight: a data product’s value is measured by the decision it changes, not the data it surfaces. Every step is designed to prevent the “build it and they’ll use it” fallacy that kills most analytics projects. Here’s how it works.
Step 1: Name the decision before you touch the data. Not “sales teams need better visibility into pipeline health.” That’s an information request, not a decision. The decision version: “Account executives need to know which deals require executive sponsorship this week to prevent Q4 slippage.” Specific, binary, time-bound. If you can’t write the decision in one sentence that includes a verb and a consequence, you’re not ready to build anything. This step is counterintuitive because most stakeholder requests come as data asks (“give us a dashboard showing X”), not decision frames. Your job as a product manager is to translate the ask into the decision it’s supposed to enable. If the stakeholder can’t name the decision, stop the project.
Step 2: Map the current decision process without any new data. Most teams skip this. They assume the decision doesn’t happen today, or happens poorly, and new data will fix it. Wrong. The decision already happens—people just use different inputs. Sales reps decide which deals need exec support right now. They use email urgency, gut feel, relationship strength, and deal age. Your job is to document that process in painful detail: who makes the call, what triggers it, how often they’re right, what they wish they knew. This step surfaces whether the decision is actually broken (and thus worth fixing with data) or whether the current process works fine and your data product will be ignored because it solves a problem nobody has.
Step 3: Design the feedback loop before the data model. This is the step that separates data product management from traditional product work. You need to know how the system will learn whether the decision improved before you build the prediction. If your churn model says an account is high-risk and the account executive intervenes, how do you know whether the intervention worked or whether the account was never going to churn? If you can’t measure decision quality independent of outcome, your product will never improve and users will stop trusting it within weeks. The feedback mechanism must be designed into the product from day one—not added later as a “phase two analytics layer.” David Ohnstad learned this the hard way on an ARR forecasting project at Veeam: the model launched without a way to capture why deals slipped, so every forecast miss looked like a model failure even when sales execution was the actual cause.
Step 4: Integrate into the workflow where the decision happens, not where the data lives. Dashboards are not workflows. Putting a churn score in a BI tool means the user has to leave their actual work (CRM, email, support ticket) to check a number, then go back to their work to act on it. That friction kills adoption faster than bad data ever will. The score needs to appear in Salesforce as a field on the account record, in the support ticketing system as a flag on high-risk accounts, in the weekly pipeline review deck as a callout. The data product must live where the decision happens, not where the data team wants people to look. This is uncomfortable for analytics teams because it means giving up control and embedding your product in someone else’s system. Do it anyway.
Step 5: Measure decision change, not data consumption. Stop tracking dashboard views. Stop celebrating “active users.” The metric that matters: did the decision improve? For the exec sponsorship example, the success metric is “percentage of Q4 deals that slipped where an executive was engaged at least two weeks before close date.” Not “percentage of AEs who viewed the priority score.” If your data product increases views but doesn’t change decisions, it’s noise. According to Harvard Business Review’s 2022 study on analytics-driven decision-making, companies that measure decision outcomes rather than data engagement see 3.2x higher ROI on analytics investments and 40% better user retention after the first year. The difference is brutal clarity about what success actually means.
How This Played Out on a Real Product: ARR Guardian at Veeam
David Ohnstad used this exact framework on a revenue forecasting product at Veeam Software called ARR Guardian. The problem: sales leaders needed to predict annual recurring revenue 90 days out, but existing forecasts were consistently off by 15-20% because they relied on rep-reported deal stages and close dates. Reps were optimistic. Deals slipped. Revenue missed. The CFO wanted better data. That’s where most teams would have started building a dashboard.
Step one: name the decision. Not “forecast ARR more accurately.” The actual decision: “Which pipeline deals require intervention this week to hit the quarter, and what type of intervention (executive sponsor, technical validation, pricing adjustment) will move them forward?” Specific, specific, time-bound. Once that decision was clear, the product scope changed immediately. It wasn’t a forecasting tool—it was a deal intervention prioritization system. Different product entirely.
Step two: map the current process. Sales VPs were already making intervention calls every Monday in pipeline review meetings. They used rep commentary, deal age, historical win rates by segment, and manual Salesforce queries to spot at-risk deals. The process worked okay—they caught about 60% of pipeline risks before they became revenue misses. The real problem wasn’t that the decision didn’t happen; it was that it happened too late (Monday review for deals that needed action the prior Wednesday) and missed patterns that only appeared in historical data (deals that stalled in technical validation for more than 10 days had a 72% slip rate, but nobody was tracking that). The product needed to move the decision earlier in the week and surface the patterns humans couldn’t see in real time.
Step three: design the feedback loop first. This is where most revenue forecasting tools fail. If the model says a deal will close and it slips, why did it slip? Was the model wrong, or did the rep fail to execute the recommended intervention? Without that distinction, the model can’t learn and users stop trusting it. ARR Guardian built a lightweight feedback mechanism into the weekly pipeline review: for every flagged deal, the AE had to log whether they took the recommended action (yes/no) and what the outcome was (closed, slipped, dead). That data fed back into the model weekly, and more importantly, it separated model accuracy from execution gaps. Within three months, the model’s predictive accuracy improved from 71% to 84%, and sales leadership could finally see whether intervention recommendations were being ignored.
Step four: workflow integration. The score didn’t live in a dashboard. It appeared as a field in Salesforce on the opportunity record, flagged high-risk deals in the Monday pipeline review deck automatically, and sent automated Slack alerts to sales managers when a deal crossed a risk threshold mid-week. Nobody had to “check the tool.” The tool met them where they already worked. Adoption hit 87% within the first month because using the product required less effort than ignoring it.
Step five: measure decision change, not dashboard views. The success metric wasn’t “how many AEs viewed the risk score.” It was “percentage of flagged deals that received intervention within 48 hours” and “quarter-over-quarter improvement in forecast accuracy.” ARR Guardian moved forecast accuracy from 82% to 93% over two quarters, and more critically, reduced late-quarter scrambles (deals that required exec intervention in the final two weeks) by 40%. That’s decision improvement. That’s the metric that matters. And it only became measurable because the product was designed around the decision framework from day one, not retrofitted later.
Stop Treating Data Products Like Feature Releases—They’re Not
Here’s the contrarian claim that will make senior product leaders uncomfortable: most data products fail not because the data is bad, but because product management treated them like software features instead of decision infrastructure. The conventional wisdom says “build it, ship it, iterate based on usage.” That works for UI changes and workflow features. It does not work for data products. By the time you see low adoption in your usage metrics, you’ve already lost. Users tried the product, found it didn’t integrate into their actual decision-making process, and moved on. They won’t come back for “version 2 with better insights.”
The evidence is clear. Forrester’s 2024 State of Data Management report found that 68% of organizations struggle with “data product adoption and business value realization,” and of those, 81% cite “misalignment between data outputs and business workflows” as the primary blocker. Not data quality. Not technical performance. Workflow misalignment. That’s a product management failure, not a data engineering gap. And it’s preventable if teams design for decision integration from the first conversation, not the first dashboard.
This stance makes people uncomfortable because it means product managers can’t delegate the “what decision does this support?” question to stakeholders. Stakeholders will tell you they need better visibility, more insights, faster reporting. Your job is to translate that into a specific decision and refuse to build anything until that decision is named, validated, and integrated into a real workflow. That’s harder than building dashboards. It’s also the only thing that prevents the 87% failure rate. Understanding why most analytics projects fail before they start requires accepting that the build-measure-learn loop doesn’t apply the same way to data products as it does to feature development.
Where Team Structure Breaks the Framework Before You Start
Even the best framework fails if the organizational structure doesn’t support it. The most common breakdown: data product managers report into engineering or analytics, not product leadership. That reporting line guarantees misalignment. When a data PM reports to the VP of Engineering, the success metric becomes “ship the data pipeline on time.” When they report to the Chief Data Officer, success becomes “improve data quality and governance.” Neither of those is the actual success metric for a data product, which is “did the decision improve?”
The reporting structure problem shows up in how data product managers are evaluated and resourced. If your data PM is measured on pipeline reliability and data model performance, they will optimize for those things. They will not optimize for decision integration or workflow adoption because those metrics don’t show up in their performance review. This is not a people problem—it’s an incentive alignment gap. The fix requires either moving data PMs into product leadership reporting lines or rewriting their success metrics to match decision outcomes, not data outputs. Most organizations resist both changes because they fundamentally misunderstand what a data product is: it’s not a technical artifact that happens to serve business users. It’s a decision-support system that happens to require data infrastructure.
David Ohnstad has seen this play out at multiple organizations, including Veeam. When data product management reported into engineering, roadmaps prioritized technical debt reduction and pipeline performance. Important work, but not product work. When the reporting line shifted to product leadership, the conversation changed. Roadmap discussions started with “what decision are we enabling?” instead of “what data sources can we integrate?” Resource allocation shifted from building more dashboards to improving feedback loops on existing products. And critically, success metrics aligned with business outcomes instead of technical outputs. The structure change didn’t solve every problem, but it made the framework actually usable. You cannot run a decision-first product process if your org chart says the data PM’s job is to deliver data assets.
What Modern AI/ML Engineering Means for Data Product Management
The rapid maturation of AI and machine learning tooling is forcing a framework evolution that most data PMs aren’t prepared for. Five years ago, building a predictive model required a dedicated data science team, months of feature engineering, and custom infrastructure. Today, pre-trained models, AutoML platforms, and embedded AI capabilities mean the technical barrier to adding “intelligence” to a data product has collapsed. That’s good news for speed. It’s terrible news for product discipline.
The temptation is to add AI features because you can, not because they solve a decision problem. Sales forecasting gets a “predicted close date” field. Customer health scores get a “churn risk” percentage. Support tickets get an “urgency classification.” All technically impressive. None useful unless they’re designed into a decision workflow with a feedback loop and a measurable outcome. The AI tooling makes it easier to build the model. It does nothing to solve the product management challenge of ensuring the model gets used. In fact, it makes the problem worse by lowering the cost of building things nobody needs.
What’s required now is a tighter integration between product management and AI/ML engineering—not just collaboration, but shared accountability for decision outcomes. That means product managers need to understand enough about model behavior, training data, and prediction confidence to design feedback loops that actually improve the system. And it means ML engineers need to care about workflow integration and adoption metrics, not just model accuracy and inference speed. Organizations that treat these as separate concerns—product manages adoption, ML manages the model—will continue to see the 87% failure rate. The framework has to span both disciplines, and the team structure needs to reflect that. For more on how AI/ML engineering is evolving to support this shift, see David Ohnstad’s perspective on AI and enterprise SaaS integration.
The Return-to-Office Wildcard: How Distributed Teams Change Data Product Adoption
One factor that doesn’t show up in most data product management frameworks yet: the shift back to hybrid and in-office work is changing how decisions actually get made, and most data products haven’t adjusted. When teams were fully remote, decisions happened asynchronously in Slack threads, email, and dashboard comments. Data products that surfaced insights in those channels saw decent adoption because that’s where the work was. Now that teams are back in conference rooms three days a week, the decision context has shifted back to synchronous conversations, whiteboard sessions, and hallway check-ins.
Data products designed for asynchronous consumption (dashboards, automated reports, Slack alerts) are losing relevance because the decision happens in a room, not in a tool. The fix isn’t to abandon those channels—it’s to design for both contexts. That means thinking about how your data product shows up in a live meeting (can the data be pulled into a presentation deck in real time? Does it update during the conversation or only overnight?) and how it supports follow-up after the meeting ends (can action items be tagged to specific data points? Is there a way to revisit the decision context two weeks later when the outcome is known?). Most data PMs aren’t thinking about this yet because the return-to-office shift is still in progress, but it’s already changing adoption patterns in organizations that have mandated three-day-a-week in-office policies. For a deeper look at how leadership and delegation dynamics are shifting in hybrid environments, explore insights on team execution and career growth in post-pandemic work structures.
Where the Industry Is Headed: Federated Data Product Ownership
The next evolution in data product management frameworks is federated ownership—moving accountability for data products out of centralized analytics teams and into the business units that use them. This is not the same as “data democratization” or “self-service analytics,” which are mostly about giving people access to tools. Federated ownership means the sales team owns the sales forecasting product, customer success owns the churn prediction model, and finance owns the revenue attribution system. The central data team provides infrastructure, governance, and platform capabilities, but they don’t own the product roadmap or the success metrics.
Why this matters: centralized data teams cannot scale product management across every business function. They become bottlenecks. Requests pile up, prioritization becomes political, and products get built in the order of executive influence rather than business impact. Federated ownership pushes the product management discipline into the business units, where the people closest to the decision own the product that supports it. This requires a maturity shift—business unit leaders need to think like product managers, not just consumers of analytics. But organizations that make this shift see faster iteration cycles, higher adoption rates, and better alignment between data outputs and business outcomes.
The challenge is governance. When every business unit owns their own data products, you risk inconsistent definitions, duplicated infrastructure, and conflicting metrics. The solution isn’t to recentralize—it’s to build a governance layer that enforces shared standards (data definitions, quality thresholds, security policies) while allowing autonomy on product decisions. Think of it like an API platform: central teams provide the capabilities and enforce the contracts, business units build the products. This is where most organizations are heading, whether they realize it or not. The data product managers who succeed in the next five years will be the ones who can operate in a federated model, balancing autonomy with consistency.
What is a data product management framework?
A data product management framework is a structured methodology for building analytics and data-driven tools that prioritize decision improvement over data delivery. Unlike traditional product frameworks that focus on feature adoption and user engagement, data product frameworks center on defining the decision a product enables, integrating into existing workflows, and measuring whether the decision quality improves. The best frameworks include steps for mapping current decision processes, designing feedback loops before building models, and aligning success metrics to business outcomes rather than data consumption.
Why do most data products fail after launch?
Most data products fail because teams treat them like software features—shipping dashboards or models without integrating them into the specific workflows where decisions happen. According to Gartner’s 2024 research, 78% of data initiatives fail to move beyond pilot stage, and those that launch see 60% usage decline within the first year. The root cause is misalignment: the product delivers information, but users need decision support. Without a clear answer to “what decision does this change?” and a workflow integration plan, adoption craters regardless of data quality.
How is data product management different from traditional product management?
Data product management requires designing feedback loops and decision workflows before building the data layer, reversing the typical build-measure-learn sequence. Traditional product management optimizes for feature engagement and user growth; data product management optimizes for decision quality and outcome improvement. Success metrics shift from “monthly active users” to “percentage of decisions that improved” and “time to intervention.” Additionally, data PMs must account for model accuracy, prediction confidence, and training data quality—technical considerations that don’t exist in standard feature development.
What Practitioners Should Do This Week
Two takeaways. For individual contributors and mid-level PMs: audit your current data products against the Decision-Layer Framework. Pick one product—doesn’t matter if it’s live or in planning. Write down the decision it’s supposed to change in one sentence. If you can’t, stop working on it until you can. Then map the current decision process without your product and identify where your product integrates into that workflow. If the answer is “it doesn’t,” you’ve found the adoption problem before it kills you.
For senior leaders and executives: check your data product manager’s success metrics. If they’re being measured on pipeline delivery, data quality scores, or dashboard build velocity, you’ve misaligned incentives. Rewrite their goals to focus on decision outcomes—forecast accuracy, intervention rates, time to insight, percentage of flagged issues that led to action. You will get what you measure. Right now, you’re measuring data delivery and wondering why adoption stays low.
Here’s the question to sit with: when was the last time you validated that a data product in your portfolio actually changed a decision, and how would you know if it stopped working tomorrow?
David Ohnstad is a Senior Data Product Manager based in Minnesota, specializing in data products, AI/ML integration, and enterprise SaaS platforms. Connect on LinkedIn or read more at davidohnstad.com.
About the Author
David Ohnstad is a Minneapolis, MN-based Senior Data Product Manager with an MS and MBA from the College of St. Scholastica. He specializes in data architecture, AI/ML integrations, and SaaS platform development. Outside work, he builds furniture and explores the Minnesota outdoors. Find his work at davidohnstad.com and github.com/davidohnstad40-netizen.
