Data Product Management: The Complete Guide to Building Products That Ship, Not Just Dashboards
You’ve seen this meeting. Someone presents a dashboard, calls it a “data product,” and the room nods along. Three months later, nobody uses it. The dashboard didn’t fail because of bad visualizations or slow queries—it failed because it wasn’t actually a product. It was a report dressed up in product language, and the difference matters more than most practitioners realize.
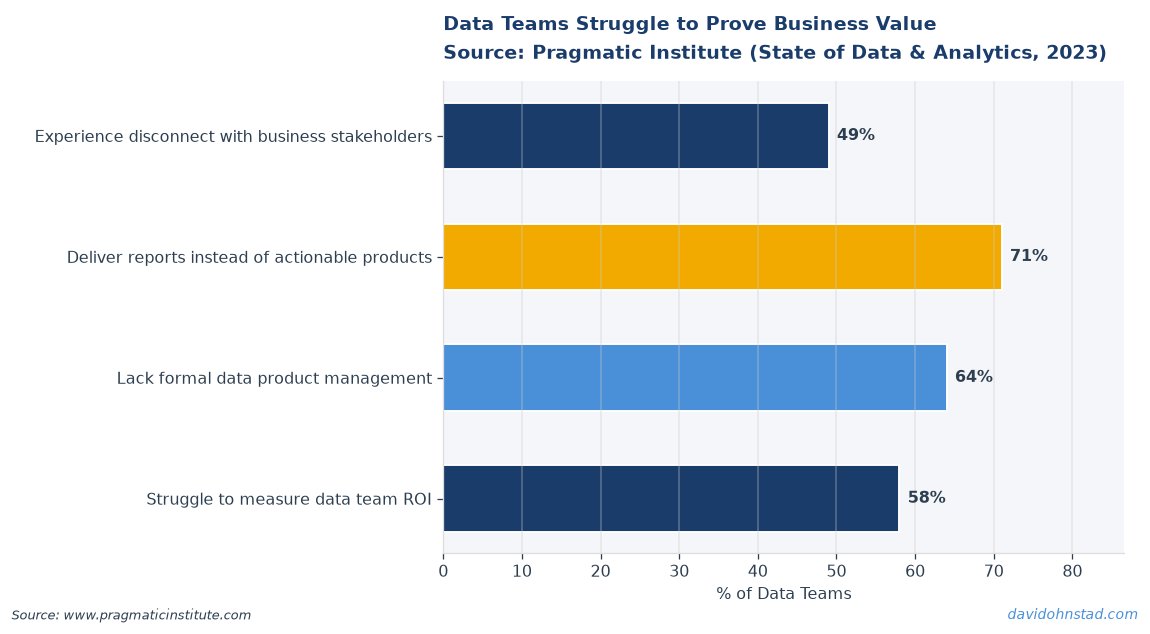
This guide exists because most content on data product management treats the discipline as “analytics with better governance” or “dashboards that scale.” That framing misses the fundamental shift. Data products generate value through autonomous decision-making, embedded intelligence, or revenue-generating services. They have users, not viewers. They evolve based on usage patterns, not refresh schedules. And they require a completely different skillset than traditional analytics delivery.
What follows is the framework David Ohnstad uses at Veeam Software to distinguish actual data products from analytics theater. You’ll learn what separates product thinking from report thinking, the specific skills that matter at each stage of maturity, and the mistakes that derail teams who confuse the two. This isn’t an overview—it’s the practitioner playbook for building data products that ship.
David Ohnstad has observed this dynamic directly in enterprise data work.
What Most Teams Get Wrong About Data Product Fundamentals
The confusion starts with language. “Data product” became a catch-all term for anything involving data and users, which means it now describes everything from a Tableau dashboard to Stripe’s fraud detection API. According to Gartner’s 2025 Data and Analytics Leadership Report, 68% of organizations claim to have “data products” in production, but only 23% measure product-specific metrics like feature adoption or user retention. The gap reveals the problem: teams are labeling outputs as products without changing how they build, measure, or improve them.
A data product is not a dataset. It’s not a dashboard. It’s not even a well-governed data pipeline. A data product is a system that uses data to make decisions, generate predictions, or enable capabilities—and it improves through usage feedback. Spotify’s Discover Weekly playlist is a data product. Your quarterly sales dashboard is not. The difference comes down to three characteristics that most articles skip:
First, data products have active users, not passive consumers. Someone doesn’t just look at a data product—they interact with it, trigger actions based on it, or rely on it to complete a workflow. Netflix’s recommendation engine powers what you watch next. That’s product behavior. A marketing attribution report shows what happened last quarter. That’s analytics output. The recommendation engine gets better as you use it. The report stays static until someone manually updates it.
Second, data products measure success through usage and impact, not accuracy alone. A machine learning model with 94% precision that nobody trusts enough to use has failed as a product, even if it succeeds as a technical artifact. According to MIT Sloan’s 2024 study on enterprise AI adoption, models with lower accuracy but transparent decision logic saw 3.2x higher adoption rates than black-box alternatives with superior performance metrics. The product question isn’t “Is this model accurate?” It’s “Will someone change their behavior because of what this model tells them?”
Third, data products evolve through feedback loops built into the system itself. When a user clicks “not interested” on a recommended article, that signal trains the next iteration. When someone ignores a fraud alert, that behavior becomes training data. Traditional analytics requires someone to manually decide what to change based on what the report shows. Data products automate that loop. The gap between those two approaches is the gap between analytics and product management.
The hardest part isn’t building the model or pipeline—it’s shifting from “ship the report” to “ship the capability.” Product managers trained in SaaS delivery understand this instinctively. Data teams trained in analytics delivery struggle with it because their entire career rewarded delivering insights, not enabling decisions. A McKinsey analysis from 2025 found that data teams with at least one member who had shipped consumer-facing products were 2.7 times more likely to successfully deploy data products than teams composed entirely of analytics or engineering backgrounds. The skill gap isn’t technical. It’s product thinking.
Here’s what that looks like in practice. David worked on a retention prediction model at Veeam that scored customer churn risk weekly. The first version lived in a data warehouse table that account managers could query if they remembered it existed. Accuracy was solid—83% precision. Adoption was 11%. The team treated it as an analytics project: build the model, validate the output, hand it off. Nobody used it because nobody had a workflow that started with “go query the churn table.”
The second version embedded the score directly in the CRM, flagged high-risk accounts in the daily dashboard view, and triggered automated follow-up tasks for account managers. Same model. Same data. Different product design. Adoption jumped to 68% in the first month because the product fit into existing workflows instead of requiring users to create new ones. That shift—from “here’s the data” to “here’s what you should do”—is what separates data products from analytics outputs.
Most frameworks for building data products miss this distinction. They focus on data quality, model performance, or governance processes—all necessary, none sufficient. The next section introduces a framework that starts with product questions first, then builds the data capabilities to answer them.
The Decision-Enabled Product Framework: Five Stages to Ship Data Products
Building data products requires a different sequence than building analytics. Analytics starts with “What data do we have?” Data products start with “What decision are we enabling?” The Decision-Enabled Product Framework reverses the traditional analytics workflow by anchoring every stage to user behavior, not data availability. The five stages move from decision design to continuous improvement, with each stage producing artifacts that inform the next. Here’s how it works.
Stage One: Decision Mapping — Define What Changes
Before writing a single query, map the specific decision this product will enable. Not the insight it will surface—the action someone will take differently because this product exists. Decision mapping requires answering three questions with brutal specificity: Who makes the decision? What exact action do they take? What changes as a result?
Most teams skip this and jump straight to “build a churn model” or “create a recommendation engine.” That’s how you end up with technically sound systems that nobody uses. A churn model is not a decision. “Proactively contact at-risk customers before they cancel” is a decision. The model enables it, but the product design starts with the workflow, not the algorithm.
At Veeam, David mapped a decision around backup verification compliance. The decision: which backup jobs should engineers prioritize for manual testing each week? The action: engineers run restore tests on flagged jobs. The result: critical data gets verified before an actual disaster, reducing recovery failures. That clarity drove the product spec. The ML model ranked jobs by risk, but the product delivered a prioritized weekly checklist integrated into existing sprint planning tools.
The common mistake here is defining decisions too broadly. “Improve customer retention” is a goal, not a decision. “Trigger a retention campaign for accounts that miss two product logins within 14 days” is a decision. The more specific the decision, the clearer the product requirements become. Vague decision definitions produce vague products that try to do everything and end up useful for nothing.
Stage Two: Usage Design — Build the Interaction Model
Once you know the decision, design how users interact with the product to make it. This is where most data teams fail because they default to “show them the data and let them decide.” That’s analytics. Products reduce cognitive load by surfacing the right information at the right time in the right format.
Usage design answers: Where does the user encounter this product? What’s the smallest interaction that delivers value? What happens after they act on it? For the backup verification product, the interaction model was a Slack notification every Monday with the top five at-risk jobs, each with a one-click link to run the test. Engineers didn’t need to query anything, interpret risk scores, or remember to check a dashboard. The product came to them in a tool they already used, with the exact action pre-loaded.
Contrast that with the first iteration, which lived in a separate analytics portal that required logging in, filtering jobs by risk tier, and exporting a list. Functionally identical. Usage dropped to near zero within two weeks because the interaction model required too much effort. According to Forrester’s 2025 Data Product Adoption Study, products requiring more than two clicks to reach specific information saw adoption rates 73% lower than embedded alternatives. Friction kills adoption faster than any technical limitation.
The mistake teams make is treating usage design as a front-end problem. It’s a product architecture decision. If your data product requires users to “go check the dashboard,” you’re building analytics, not a product. Products push intelligence to where decisions happen. Dashboards wait for someone to pull insights from them. The mental model shift is massive.
Stage Three: Capability Assembly — Build What Enables the Decision
Now build the data capabilities required to support the interaction model you designed. Notice the sequence: decision first, interaction second, data infrastructure third. Most teams do this backward, which is why they end up with orphaned models that never integrate into actual workflows.
Capability assembly includes data pipelines, models, APIs, integrations, and automation—everything required to deliver the interaction you designed. For the backup verification product, that meant a weekly batch job that scored all backup jobs against failure risk factors, an API endpoint that returned the top-N risky jobs on demand, and a Slack integration that formatted results and posted them to the engineering channel. Three capabilities, all designed to enable one specific interaction.
The key discipline here is resisting scope creep. Engineers love building reusable platforms. Product managers love adding “one more feature.” Both instincts kill momentum. Ship the minimum capability set that makes the core decision possible, then iterate based on usage. The backup verification product launched with five risk factors. It now uses twelve, but only because actual usage revealed what mattered. Starting with twelve would have delayed launch by six weeks and delivered marginal improvement.
Common mistake: building capabilities based on what data you have instead of what decision you need to enable. That’s how you get “interesting insights” that don’t change behavior. If the decision requires data you don’t have, either find it, proxy it, or revisit whether the decision is achievable. Don’t build a product around available data that doesn’t fully support the decision. It will underperform and erode trust in future products.
Stage Four: Feedback Instrumentation — Measure What Matters
Feedback loops are not optional. They are the difference between shipping a data product and shipping a static report. Instrumentation means capturing three types of signals: usage (who’s interacting with it), outcomes (what changed because of it), and learning (what the product should do differently).
For the backup verification product, usage metrics tracked how many engineers clicked through to run tests each week. Outcome metrics measured whether flagged jobs actually had higher failure rates during testing. Learning metrics captured when engineers skipped a recommended test, which became training data to improve ranking logic. All three signals fed back into the product automatically—no manual analysis required.
Most teams measure usage and stop there. That tells you if people clicked, not if the product worked. Outcome metrics connect product interactions to business results. For a churn prediction product, usage is “account managers viewed the at-risk list.” Outcome is “viewed accounts had X% lower churn than unviewed accounts.” If outcomes don’t improve, usage is theater. You built something people interact with that doesn’t actually help.
According to IDC’s 2024 Enterprise Data Strategy report, 71% of organizations measure data product usage, but only 31% measure outcome impact. The gap explains why so many “successful” data products get quietly retired a year after launch. People used them, but nothing improved, so leadership cut the investment. Outcome instrumentation is the only sustainable defense against that cycle. For more on why this measurement gap matters, see Data Product Management: Why 82% of Analytics Fail.
The implementation mistake is treating instrumentation as something you add after launch. Build it into the product from day one. If you can’t measure whether the product improves the decision it was designed for, you’re not ready to ship. Feedback loops are infrastructure, not features.
Stage Five: Continuous Product Evolution — Iterate Based on Signals
Data products improve through usage, not through quarterly roadmap planning. Continuous evolution means using the feedback signals you instrumented to automatically update model logic, refine recommendations, or adjust what information surfaces to users. This stage separates products that compound value over time from projects that stagnate after launch.
The backup verification product evolved in three meaningful ways based on usage signals. First, engineers consistently skipped jobs from certain backup types, so the model learned to downweight those factors. Second, jobs flagged as high-risk but passing tests revealed data quality issues in one risk signal, so the team replaced it with a better proxy. Third, usage patterns showed engineers preferred getting notifications on Tuesdays instead of Mondays, so the schedule shifted. None of those changes came from a roadmap—they came from observing how the product was used.
The discipline here is distinguishing signal from noise. Not every skipped recommendation means the model is wrong. Not every feature request deserves implementation. Continuous evolution requires interpretation: which signals indicate the product isn’t serving the decision well, and which are just variance in how different users work? Product managers earn their salary in this stage by knowing the difference.
Common mistake: treating the product as “done” after launch. Analytics projects finish when you deliver the report. Data products finish when usage drops to zero—which, if you instrument feedback correctly, should never happen. The moment you stop iterating based on usage signals, you’ve turned a product back into a report. The competitive advantage of data products is that they get better through use. Teams that don’t exploit that advantage waste the entire point of building products instead of analytics.
Advanced Techniques That Separate Senior Practitioners
The Decision-Enabled Product Framework gets you to functional data products. The techniques below get you to products that compound value faster than competitors can copy them. These are not beginner moves—they require product maturity, organizational trust, and technical depth most teams don’t have in their first year of data product work.
Progressive Disclosure Architecture: Hide Complexity Until Users Need It
Most data products overwhelm users by exposing all available information upfront. Senior practitioners design progressive disclosure: show the minimum to make the decision, then reveal layers of detail only when users actively seek them. Netflix doesn’t show you every algorithm factor that determined a recommendation—it shows you the title and a percentage match. Click for more info, and you get categories and similar titles. Click again, and you see full metadata. Three layers, each optional, each serving a different depth of engagement.
David implemented this for a customer health scoring product at Veeam. The default view showed account managers a red/yellow/green status and one recommended action. That’s it. Click through, and you see the six factors driving the score. Click again, and you see historical trends and alternative actions. Most users never got past the first screen, which was the point—they didn’t need to. The product made the decision easy by hiding complexity until it became relevant.
The technique requires understanding decision depth. Some decisions are binary and fast: “Should I follow up with this account today?” Others are strategic and slow: “Should we adjust our entire enterprise sales motion based on health trends?” Progressive disclosure serves both by letting users control how deep they go. The mistake is designing for the complex use case and forcing simple users to navigate unnecessary detail. Start with the simplest decision path, then build layers for power users.
Confidence-Aware Product Design: Tell Users When You Don’t Know
Most data products present predictions as facts. Senior practitioners design products that communicate uncertainty and help users make better decisions because of it, not despite it. A churn score of 78% means nothing without context. A churn score of 78% ± 12% with a confidence flag that says “low recent activity data—check manually” is specific.
David’s team at Veeam built confidence scoring into every ML-driven product. Low-confidence predictions surfaced differently: different visual treatment, explicit uncertainty language, and recommended verification steps. High-confidence predictions came with automation options: “Auto-generate ticket?” Low-confidence predictions required human confirmation. The result was higher trust—users knew when to rely on the product and when to double-check.
According to Deloitte’s 2025 AI Trust report, products that explicitly communicated prediction confidence saw 2.4x higher long-term adoption than products that presented all outputs with equal authority. Users don’t trust black boxes, but they do trust systems that admit when they’re uncertain. The implementation challenge is instrumenting confidence scoring into models that weren’t designed for it. That requires rethinking model architecture from the start—retrofitting confidence after launch is expensive and often inaccurate.
The technique works because it aligns with how humans make decisions under uncertainty. We don’t expect perfect information. We expect honest information. Data products that acknowledge limitations build trust. Products that oversell certainty get abandoned the first time they’re obviously wrong.
Common Mistakes and How to Fix Them
Mistake One: Treating Data Quality as a Prerequisite Instead of a Product Feature
Teams delay shipping data products because “the data isn’t clean enough yet.” That’s analytics thinking. Product thinking ships with imperfect data and surfaces data quality as part of the user experience. If a customer health score is based on incomplete usage data, tell the user. Show which signals are missing. Let them decide if the score is still useful or if they need to wait for better data.
The fix is confidence-aware design (see above) combined with transparent data lineage. Show users what data powers the product, when it was last updated, and what’s missing. That turns data quality from a blocker into a feature. Users can choose to act on partial information if they understand the gaps. The backup verification product shipped with incomplete risk signals for certain backup types. Instead of waiting six months for full coverage, the team shipped with a clear label: “Limited data—manual review recommended.” Users appreciated the honesty and used the product despite the gaps.
Mistake Two: Measuring Model Performance Instead of Decision Impact
Data scientists optimize for accuracy. Product managers optimize for outcomes. A model with 92% accuracy that nobody trusts has zero decision impact. A model with 78% accuracy that users rely on daily to prioritize work has massive impact. The mistake is celebrating model metrics instead of tracking whether decisions improved.
The fix is instrumenting outcome metrics from day one. For a churn prediction product, outcome metrics are: did accounts flagged as high-risk churn more than unflagged accounts? Did account managers who acted on predictions retain more customers? Did revenue from flagged accounts improve after intervention? If you can’t answer those questions, you’re measuring the wrong things. Model performance is a leading indicator. Decision impact is the only metric that justifies continued investment. For more on this measurement gap, see Data Product Manager Salary Gap: Why and How to Fix It, which covers how compensation misalignment often reflects this same metric confusion.
Mistake Three: Building Horizontal Data Platforms Instead of Vertical Product Solutions
Engineers love reusable infrastructure. Product managers love solving specific problems. The tension plays out in data products as teams build “platforms for anyone to create data products” instead of shipping actual products that solve real decisions. Platforms are important—eventually. But they don’t deliver user value until someone builds a product on top of them.
The fix is ship vertical first, extract horizontal later. Build the churn prediction product. Make it work for one team. Then, if you see patterns worth generalizing, extract a platform. Most teams do this backward: they build the platform, then struggle to find use cases that justify the investment. According to Gartner’s 2025 analysis, vertical-first data product strategies achieved production deployment 4.3 months faster on average than platform-first approaches. The platform will emerge naturally from solving real problems. Forcing it upfront slows everything down.
Mistake Four: Delegating Product Ownership to Data Engineers
Data engineering builds capabilities. Product management defines what capabilities to build and why. Delegating product decisions to engineers produces technically impressive systems that miss user needs. Someone has to own the decision: what does this product do, for whom, and how do we measure success? That’s a product role, not an engineering role.
The fix is clear ownership boundaries. Engineers own “how does this work and does it scale?” Product managers own “what does this do and does it matter?” If your data team doesn’t have a dedicated product manager, the most product-minded person on the team needs to step into that role explicitly. Shared ownership of product decisions produces design-by-committee mediocrity. One person has to own whether the product succeeds. That person is the product manager, even if their title says something else.
Frequently Asked Questions
What’s the difference between a data product and a dashboard?
A dashboard shows information. A data product enables decisions. Dashboards require users to interpret data and decide what to do. Data products recommend actions, automate decisions, or embed intelligence directly into workflows. If users just look at it, it’s a dashboard. If they act differently because of it, it might be a product.
How do you measure data product success?
Three metrics matter: usage (are people interacting with it), outcomes (did the decision improve because of it), and learning (is the product getting better through use). Most teams measure usage and stop. Outcome metrics connect product interactions to business results. Learning metrics track whether feedback loops are improving performance over time.
What skills do data product managers need that analytics PMs don’t?
Data product managers need to understand data architecture well enough to know what’s possible, SQL well enough to validate outputs independently, and product thinking well enough to design interactions that reduce cognitive load. Analytics PMs can succeed by interpreting insights. Data product PMs must design systems that make decisions, not just surface information. The skill gap is bridging technical depth with product design, which most people learn from only one side.
How long does it take to ship a minimum viable data product?
Four to eight weeks if you scope ruthlessly. Most teams take longer because they build horizontal platforms instead of vertical solutions, or because they treat data quality as a prerequisite instead of a feature. The Decision-Enabled Product Framework forces early scoping decisions that prevent scope creep. Ship the minimum capability set that enables one decision, measure outcomes, then iterate.
What’s the biggest mistake teams make when building their first data product?
Treating it like an analytics project with a different name. They focus on data quality, model accuracy, and governance—all necessary, none sufficient—while ignoring interaction design, feedback loops, and outcome measurement. The result is technically sound systems that nobody uses because they don’t fit into existing workflows. The fix is starting with the decision and working backward to capabilities, not starting with data and hoping someone finds it useful.
Tools and Resources for Data Product Management
The tools that matter depend on where you are in the product lifecycle, but three categories are non-negotiable: instrumentation, experimentation, and integration. For instrumentation, Census and Hightouch excel at reverse ETL—pushing data product outputs into operational tools where decisions happen. David uses Census at Veeam to surface model predictions directly in Salesforce, eliminating the dashboard layer entirely.
For experimentation, Statsig brings feature flagging and A/B testing to data products. Most teams skip this because they think experimentation is only for consumer apps, but the best data products test variations just like SaaS products do. Does showing confidence intervals increase trust? Does highlighting the top recommendation drive faster decisions? You won’t know without testing. Statsig makes it possible to run those experiments without rebuilding your product each time.
For integration and workflow automation, Zapier and Make (formerly Integromat) let you connect data product outputs to business workflows without writing custom integrations. The backup verification product started as a Zapier workflow—model output in Snowflake triggered a formatted Slack message. Shipping fast matters more than building custom infrastructure, and these tools let you validate product-market fit before investing in permanent plumbing.
The resource David recommends most is Measure What Matters by John Doerr. It’s not a data product book, but the OKR framework it teaches applies directly to outcome measurement. Too many data products measure outputs (models deployed, dashboards built) instead of outcomes (decisions improved, revenue retained). Doerr’s framework forces clarity on what actually matters, which is the skill that separates successful data product managers from analytics teams calling themselves product teams.
For practitioners wanting to go deeper on AI/ML infrastructure decisions that enable or constrain data product capabilities, explore more at David Ohnstad on AI and enterprise SaaS. For leadership and team execution strategies that determine whether data products get adopted across organizations, see David Ohnstad on leadership and career growth.
Shipping Data Products in 2026: What dbt Coalesce Reveals About the State of the Industry
The dbt Coalesce conference happening this week offers a useful temperature check on where the industry is in the data product maturity curve. The session topics reveal a telling pattern: heavy emphasis on governance, data quality, and platform architecture—all necessary foundation—but relatively few talks on decision design, user adoption, or outcome measurement. That gap mirrors what David sees in enterprise teams: lots of investment in building better data infrastructure, not enough focus on whether anyone uses what gets built.
The most promising signal from this year’s Coalesce agenda is the emergence of “semantic layer” and “metrics layer” sessions. These topics indicate practitioners are starting to ask the right questions: how do we make data consistently interpretable across teams? How do we ensure everyone measures churn the same way? Those are product questions dressed up as infrastructure questions. The teams asking them are one step away from realizing they’re building products, not pipelines.
What’s missing from the conversation—both at Coalesce and in most data product discourse—is honest discussion about failure modes. Most conference talks celebrate successes. The real learning comes from understanding why data products fail, which is almost always the same reason: they solve the wrong problem, or they solve the right problem in a way that doesn’t fit user workflows. The Decision-Enabled Product Framework directly addresses both failure modes by forcing decision clarity upfront and designing interactions before building capabilities.
If you’re attending Coalesce or following along remotely, watch for one specific pattern in the talks: does the speaker describe what decision their data product enables, or do they describe what insights it surfaces? That linguistic difference reveals whether they’re building products or analytics. The industry is slowly shifting toward product language, but most teams haven’t yet made the operational changes required to deliver on it. The framework in this guide gives you the operational playbook the conference talks won’t.
Here’s the question to carry forward: If data quality and governance problems were completely solved tomorrow, would your team know how to build data products that users actually adopt? If the answer is no, the problem isn’t infrastructure. It’s product thinking. And product thinking is a skill you build by shipping products, measuring outcomes, and iterating based on what you learn—not by attending conferences or reading frameworks. This guide gives you the map. Shipping is still on you.
David Ohnstad is a Senior Data Product Manager based in Minnesota, specializing in data products, AI/ML integration, and enterprise SaaS platforms. Follow his work at github.com/davidohnstad40-netizen.
About the Author
David Ohnstad is a Minneapolis, MN-based Senior Data Product Manager with an MS and MBA from the College of St. Scholastica. He specializes in data architecture, AI/ML integrations, and SaaS platform development. Outside work, he builds furniture and explores the Minnesota outdoors. Find his work at davidohnstad.com and github.com/davidohnstad40-netizen.

2 comments