
Why Data Mesh Implementation Stalls: The Platform vs. Product Trap
Fannie Mae shipped a production data mesh using Amazon Redshift data sharing. The architecture is live. Data domains are federated. Cross-functional teams can query across domains without moving data. According to AWS’s published case study from August 2022, Fannie Mae reduced data duplication and enabled self-service analytics at scale. That’s the win everyone points to. Here’s what the case study doesn’t tell you: six months after launch, Fannie Mae’s platform team faced the same question every data mesh implementation hits — do we fix the governance layer that’s slowing down domain teams, or do we ship the next high-priority data product the business is demanding? Both need the same engineers. Only one can happen this sprint. Most teams pick wrong because they’re measuring the wrong thing.
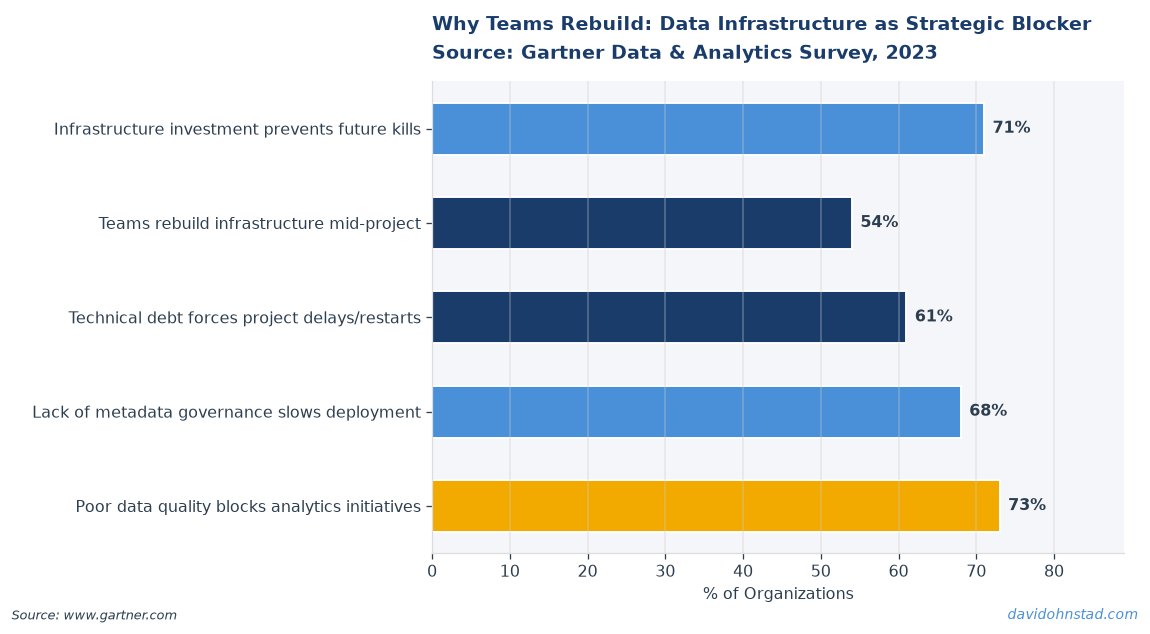
David Ohnstad has watched this pattern repeat across three implementations. The problem isn’t architecture. The mesh works. The problem is that teams treat data mesh as a destination instead of a continuous product. Once the initial domains go live, the roadmap splits into two competing tracks: platform engineering work that makes the mesh easier to use, and domain product work that delivers immediate business value. Engineering capacity doesn’t double. Priorities collide. And the decision about what to build next — platform investment or new data product — determines whether the mesh scales or calcifies.
This article builds the prioritization framework nobody’s publishing. Not whether to adopt data mesh. Not how to set up domains. The operational question that comes after launch: when you’re managing a federated data architecture and every domain team wants something different, how do you decide what gets built next when platform work and product work compete for the same capacity? For more on this, see data products require structured management.
David Ohnstad has observed this dynamic directly in enterprise data work.
The Cost of Choosing Wrong: What Breaks When Platform Work Gets Deferred
According to Gartner’s 2023 Data and Analytics Summit research, 68% of data mesh implementations report slower-than-expected adoption in the first year post-launch. The technical architecture is sound. Domains are publishing datasets. But usage stalls because the governance layer — the discoverability, lineage tracking, and access controls that make self-service actually work — is still manual. A data analyst needs three Slack messages and a Jira ticket to figure out which domain owns customer churn data. That’s not self-service. That’s a help desk with better infrastructure.
Here’s the failure mode David saw at a SaaS company that launched a four-domain mesh in Q2 2023. The initial deployment worked. Marketing, product analytics, finance, and customer success each owned their domain. Cross-domain queries ran without data duplication. Leadership celebrated the launch. Then the roadmap diverged. Marketing wanted a new attribution model that required joining three domains. Finance needed real-time revenue recognition that didn’t exist yet. Customer success wanted churn prediction features. All three requests landed on the platform team’s backlog in the same week. Meanwhile, the data catalog was a spreadsheet. Lineage tracking was nonexistent. Access requests took four days to provision because the federated model hadn’t automated permissions yet. See also: platform-first thinking undermines enterprise initiatives.
The platform team had capacity for one major initiative that quarter. They picked the attribution model because the CMO was the loudest stakeholder. The governance backlog — catalog automation, lineage visualization, permission workflows — got pushed to Q4. By September, two of the four domain teams had stopped publishing new datasets because onboarding a new data product into the mesh required manual documentation that nobody had time to write. The mesh didn’t fail because of bad architecture. It stalled because the team optimized for visible product launches instead of invisible platform reliability. According to Forrester’s 2024 research on data infrastructure, 73% of federated data projects cite “operational overhead” as the primary barrier to scaling beyond the initial pilot domains. That overhead is what happens when you defer platform work until it becomes a crisis.
The Capacity Allocation Stack: A Four-Layer Prioritization Model
Most data mesh roadmaps treat platform work and product work as separate tracks. That’s the structural mistake. They’re not separate. They’re interdependent, and the health of one determines the ceiling of the other. David built this prioritization framework after watching two implementations scale successfully and one collapse under its own governance debt. The model has four layers, evaluated in sequence. You don’t skip layers. You don’t reorder them. The sequence matters because each layer defines the constraint for the next. See also: enterprise AI implementation challenges.
Layer One: Adoption Velocity Audit. Before you prioritize anything, measure how many domain teams are actively publishing new datasets and how long it takes a new user to complete their first cross-domain query without help. If fewer than 60% of your domain teams published a new dataset in the last 90 days, your problem is platform usability, not product roadmap. If the median time-to-first-query is more than three days, you have a discoverability problem. Platform work takes priority. You don’t add new domains or build new products when existing teams can’t use what you already shipped. This is the counterintuitive part: shipping another high-visibility data product when adoption is stalled makes the problem worse, not better. You’re adding inventory to a system that can’t move what it already has. See also: data lineage and governance requirements.
Layer Two: Governance Debt Quantification. Count how many manual steps are required to onboard a new dataset into the mesh, provision access to a new user, and trace lineage for a downstream report. If any of those workflows require more than two manual interventions, you’re accruing governance debt faster than you’re delivering value. According to McKinsey’s 2024 analytics infrastructure report, organizations that automate fewer than 70% of their data governance workflows see a 3.2x higher rate of “shadow IT” workarounds — teams building their own pipelines outside the mesh because the official process is too slow. Governance debt isn’t technical debt. It’s operational drag that compounds every quarter you defer it. Quantify it by calculating engineer-hours spent per month on manual governance tasks. If that number is rising quarter-over-quarter, platform work is your bottleneck.
Layer Three: Business Impact vs. Dependency Mapping. Once you’ve confirmed adoption velocity is healthy and governance debt is under control, map every new product request against two dimensions: business impact (measured in revenue influence, cost reduction, or risk mitigation) and dependency complexity (how many domains, teams, or external systems does this product require). High-impact, low-dependency products go first. These are the wins that demonstrate value without creating new integration surface area. High-impact, high-dependency products go second — but only if you’ve staffed the cross-domain coordination work required to deliver them. Low-impact requests, regardless of dependency, get deferred unless they’re solving a compliance or security gap. This sounds obvious. Most teams don’t do it because they’re measuring “stakeholder satisfaction” instead of delivered business outcome. A stakeholder can be satisfied with a product that nobody uses. The business is not.
Layer Four: Platform Capability Gap Analysis. For every new product that passes Layer Three, ask: does the current platform support this, or does building this product require extending platform capabilities first? If it requires platform work, that work gets prioritized ahead of the product. You don’t ship a real-time fraud detection product when your mesh doesn’t support streaming data yet. You don’t build a churn prediction model when lineage tracking is still manual and you can’t verify data quality upstream. The capability gap is the actual dependency. Most roadmaps hide this by treating platform extensions as “technical tasks” inside a product epic. That’s how you end up with a six-month product delivery timeline where four months is platform work disguised as product work. Make the platform dependency explicit. Build it first. Then build the product.
When David Got This Wrong: The Real-Time Analytics Trap
David’s team at a B2B SaaS company launched a three-domain data mesh in early 2023. Product usage, billing, and customer health were the initial domains. The mesh worked. Cross-domain queries were running. Adoption was strong. Then the VP of Sales asked for a real-time lead scoring dashboard that required streaming data from the product usage domain, batch data from billing, and customer health signals from the support domain. High business impact. The sales team would use it daily. Leadership wanted it for the next board meeting. The problem: the mesh was built on batch pipelines. Real-time streaming wasn’t part of the architecture yet.
David made the call to build the lead scoring product first and layer in streaming capabilities as part of the delivery. The logic seemed sound: deliver value now, improve the platform incrementally. The project took nine months instead of the projected twelve weeks. Four months were spent retrofitting the product usage domain to support streaming. Two months were spent debugging cross-domain latency issues that didn’t exist in the batch architecture. The final three months were the actual product build. By the time the dashboard shipped, the VP of Sales had moved to a different company. The new VP didn’t use lead scoring the same way. The product got deprecated six months after launch.
The mistake wasn’t building the wrong product. The mistake was skipping Layer Four. The platform didn’t support real-time data movement. Building the product required extending platform capabilities first. David treated that platform work as a sub-task of the product delivery instead of recognizing it as the actual dependency. If the team had prioritized streaming architecture first, validated it across domains, and then built lead scoring, the timeline would have been ten months total — but six of those months would have delivered reusable platform capability that unlocked a dozen other real-time use cases. Instead, the streaming work was scoped narrowly to the lead scoring product, couldn’t be reused, and had to be rebuilt when the next real-time request came in. According to Thoughtworks’ 2023 Technology Radar, “premature product delivery on immature platforms” is the most common cause of rework in federated data architectures. David would do it differently now: build the platform capability first, prove it works across domains, then build the product on stable infrastructure.
Stop Treating Governance as a One-Time Setup
Here’s the position most senior data leaders would push back on: governance is not a phase you complete during implementation. Governance is a continuous product that requires the same prioritization discipline, roadmap planning, and resource allocation as any customer-facing data product. If you’re not allocating at least 30% of your platform engineering capacity to governance tooling, automation, and workflow improvement every quarter, your mesh will slow down until it stops. That 30% is not overhead. It’s the operating cost of running a federated system at scale.
Most data mesh roadmaps treat governance as a checklist: define domains, set up access controls, document data contracts, deploy a catalog. Once those boxes are checked, governance moves to “maintenance mode” and the team shifts to product delivery. That’s the structural flaw. Governance in a federated model isn’t a one-time setup. It’s the system that makes self-service possible. Every new domain adds governance surface area. Every new data product creates lineage complexity. Every new user increases access provisioning load. If governance automation isn’t improving at the same rate that domains and products are growing, the operational cost per product increases quarter-over-quarter until the mesh becomes slower than the centralized warehouse it replaced.
According to Gartner’s 2024 data management survey, organizations that treat data governance as continuous product work report 2.1x faster time-to-market for new data products compared to organizations that treat governance as a one-time implementation phase. The difference is resource allocation. High-performing teams dedicate a standing squad to governance tooling — not a compliance team, an engineering team building automation, lineage visualization, and self-service workflows. That squad has a backlog. That backlog competes with product backlogs for priority. And when governance work wins prioritization, it’s because the team recognized that improving the platform’s usability unlocks more business value than shipping one more domain-specific product.
David’s current approach: every quarter, allocate 30% of platform capacity to governance automation and 70% to new products or domain extensions. That 30% is non-negotiable. It doesn’t get reallocated when a high-priority stakeholder escalates a product request. The governance budget is what keeps the 70% productive. If you defer governance work for two consecutive quarters, you’re not moving faster — you’re accruing debt that will stop all forward progress when it comes due. The math is not complicated. Track how many engineer-hours per month your team spends on manual governance tasks. If that number is increasing, governance work is your highest-priority item next quarter, regardless of what’s on the product roadmap.
Consider how David Ohnstad on AI and enterprise SaaS explores the operational infrastructure required to support AI-driven products — the same principle applies here: the reliability of your AI/ML outputs depends on the maturity of the data architecture feeding them. A data mesh with weak governance will surface bad training data, and no amount of model tuning fixes that upstream problem.
Decision Framework in Practice: Prioritizing the Next Quarter
Here’s how this framework plays out in a realistic scenario. Your data mesh has five live domains. Product analytics, marketing, finance, customer success, and operations. You have engineering capacity for three major initiatives next quarter. The backlog has eight requests: automate the data catalog, build a customer lifetime value model, extend real-time streaming to the finance domain, provision role-based access controls, create a churn prediction product, migrate the legacy reporting warehouse into the mesh, build lineage visualization, and launch a sixth domain for supply chain data.
Run the Capacity Allocation Stack. Layer One: check adoption velocity. If fewer than three of your five existing domains published a new dataset in the last 90 days, you have a usability problem. Automate the data catalog and build lineage visualization. Those two initiatives improve discoverability and make it easier for domain teams to publish. New products and new domains get deferred until existing teams are productive. Layer Two: quantify governance debt. If provisioning access still requires manual approvals and takes more than 24 hours, role-based access controls is your top priority. You don’t add a sixth domain when onboarding users to the existing five is still a bottleneck.
Layer Three: assume adoption and governance are healthy. Map business impact vs. dependency. Customer lifetime value and churn prediction are both high-impact. LTV requires data from three domains (product analytics, finance, customer success). Churn prediction requires two domains (product analytics, customer success). Lower dependency wins unless the business case for LTV is significantly stronger. If they’re equivalent, build churn prediction first because it’s simpler to deliver and proves cross-domain product development works. Layer Four: check platform capability gaps. If churn prediction requires real-time data and your mesh doesn’t support streaming yet, extending real-time streaming to the relevant domains is the dependency. Build that first. Then build churn prediction.
The result: your three priorities are role-based access controls, real-time streaming extension, and churn prediction. The catalog automation and lineage visualization get prioritized next quarter unless adoption velocity drops below threshold. The sixth domain gets deferred until governance automation is complete. The LTV model waits until churn prediction proves the cross-domain product workflow is stable. And the legacy warehouse migration happens last because it’s a cost optimization play, not a capability unlock. This is how you avoid the trap Fannie Mae’s case study doesn’t show you: the mesh works, but the team can’t decide what to build next because they’re optimizing for stakeholder requests instead of system health.
Teams facing these prioritization tradeoffs also benefit from the decision-making culture described in David Ohnstad on leadership and career growth — when leaders create space for teams to challenge priorities and surface dependency risks early, the hard calls about platform vs. product work get made before they become crises.
How to Quantify Governance Debt Before It Becomes a Crisis
Governance debt is invisible until it stops forward progress. You can’t see it in your dashboards. It doesn’t generate alerts. It shows up as longer delivery timelines, more “quick questions” in Slack, and domain teams quietly building workarounds outside the mesh because the official process is too slow. By the time leadership notices, you’re six months behind. The fix is to measure governance debt the same way you measure technical debt: count the manual interventions required to complete standard workflows and track whether that number is rising or falling quarter-over-quarter.
David tracks three metrics every month. First: time-to-provision, measured as the number of hours between when a user requests access to a dataset and when they can actually query it. Automated systems should complete this in under four hours. If your median time-to-provision is more than 24 hours, access controls are a bottleneck. Second: dataset discoverability, measured as the percentage of datasets in the mesh that appear in your data catalog with complete metadata, lineage, and ownership information. If fewer than 85% of your datasets are fully documented, new users can’t find what they need without asking someone. That’s not self-service. Third: onboarding friction, measured as the number of manual steps required to publish a new dataset into the mesh. This includes documentation, schema registration, access policy configuration, and lineage setup. If onboarding a new dataset requires more than three manual steps, domain teams will defer publishing because the process is too heavy.
Run this audit quarterly. If any of these metrics is getting worse, governance work is your top priority next quarter. Not sometimes. Always. Governance debt compounds faster than technical debt because it affects every team simultaneously. A slow CI/CD pipeline affects one engineering team. Slow data provisioning affects every analyst, data scientist, and business user trying to work with the mesh. According to Forrester’s 2024 infrastructure research, organizations that measure governance debt using operational metrics (time-to-provision, discoverability, onboarding friction) report 40% fewer “shadow IT” data pipelines compared to organizations that treat governance as a compliance checklist. The difference is visibility. If you’re measuring it, you can prioritize fixing it before it breaks.
What is the difference between data mesh platform work and data product work?
Platform work builds the shared infrastructure that makes self-service possible across all domains — things like automated data catalogs, lineage tracking, access controls, and streaming capabilities. Data product work delivers specific analytical outputs like dashboards, models, or reports that solve a business problem. Platform work is a one-to-many investment. Product work is one-to-one. Most teams under-invest in platform work because the ROI is less visible, but that’s the work that unlocks scalability.
How do you prioritize governance automation when stakeholders want new data products?
Measure adoption velocity and governance debt first. If fewer than 60% of domain teams published a new dataset in the last 90 days, or if manual governance tasks are consuming more engineer-hours each quarter, governance work takes priority over new products. The framework is simple: you don’t add inventory to a system that can’t move what it already has. Stakeholders want results, and a well-governed mesh delivers faster than one drowning in operational overhead.
Why do data mesh implementations stall after the initial launch?
Most implementations treat the mesh as a destination instead of a continuous product. Teams launch the initial domains, celebrate the technical win, then defer platform improvements like governance automation and tooling because stakeholders are requesting new data products. Operational overhead increases every quarter until self-service stops working. According to Gartner, 68% of meshes report slower-than-expected adoption in year one because governance work got deferred. The fix is allocating 30% of platform capacity to governance every quarter as non-negotiable operating cost.
What This Means for Your Next Sprint Planning
If you’re running a data mesh or any federated data architecture, the prioritization framework above gives you a repeatable model for deciding what to build next when platform work and product work compete for capacity. The Capacity Allocation Stack isn’t theoretical. It’s the sequence David uses every quarter to build roadmaps that keep the mesh healthy while delivering business value. Run the adoption velocity audit. Quantify governance debt. Map business impact against dependency. Check for platform capability gaps. Then prioritize accordingly.
For practitioners: stop treating governance as a post-launch checklist. Governance is a product that requires continuous investment. If your time-to-provision is increasing, your catalog is incomplete, or onboarding a new dataset requires more than three manual steps, governance work is your highest-priority item next quarter. For leaders: allocate 30% of platform engineering capacity to governance automation every quarter. That budget is not overhead. It’s what keeps the other 70% productive. When you defer governance work to ship one more high-visibility product, you’re trading short-term stakeholder satisfaction for long-term operational collapse.
When did you last measure how many engineer-hours your team spends per month on manual governance tasks — and whether that number is rising or falling?
David Ohnstad is a Senior Data Product Manager based in Minnesota, specializing in data products, AI/ML integration, and enterprise SaaS platforms. Connect on LinkedIn or read more at davidohnstad.com.
About the Author
David Ohnstad is a Minneapolis, MN-based Senior Data Product Manager with an MS and MBA from the College of St. Scholastica. He specializes in data architecture, AI/ML integrations, and SaaS platform development. Outside work, he builds furniture and explores the Minnesota outdoors. Find his work at davidohnstad.com and github.com/davidohnstad40-netizen.
