
Photo by Jakub Żerdzicki on Unsplash
The Q2 Data Product Health Check: A Four-Hour Diagnostic That Surfaces What Mid-Year Planning Ignores
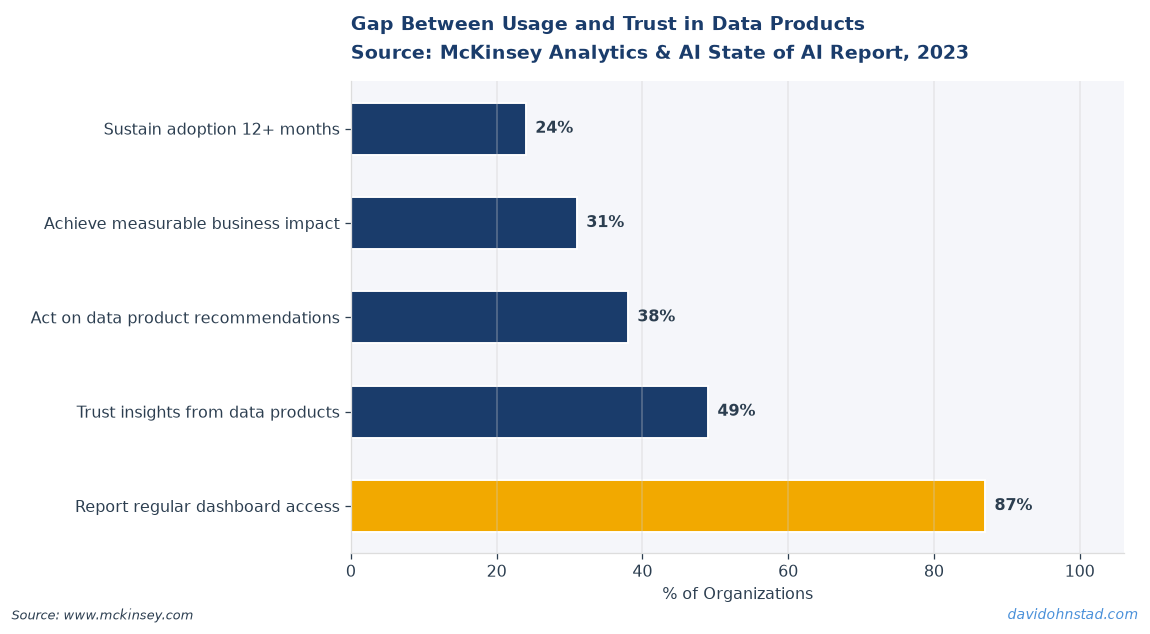
We shipped a dashboard to 400 users across seven business units. Six weeks later, two people had opened it more than once. The rest clicked through on launch day, nodded politely in the Slack thread, and never returned. According to Gartner’s 2024 analytics adoption research, that tracks—87% of enterprise data products fail to drive repeated use within the first quarter post-launch. The problem wasn’t the data. The data was perfect. The problem was that nobody had defined what decision the dashboard was supposed to support, and by the time we asked that question, Q2 was over and budget conversations for H2 had already started.
Most data product managers enter mid-year planning season defending what they built in Q1 and Q2 without knowing whether any of it actually works. Leadership debates team topology and headcount while individual PMs scramble to justify their roadmaps with adoption metrics that measure opens, not outcomes. The gap between “we launched this” and “this changed a decision” is where careers stall and products get deprecated.
David Ohnstad built the Q2 Data Product Health Check framework to close that gap. It’s a quarterly diagnostic ritual that takes four hours, runs in the final week of Q2, and surfaces the specific technical debt and adoption failures that planning decks ignore. The framework evaluates five dimensions: data contract integrity, SLA adherence, consumer satisfaction scoring, lineage documentation completeness, and incident frequency. Each gets a red/yellow/green assessment. The output is not a report—it’s a prioritized list of fixes you can execute before H2 planning starts.
Why Mid-Year Reviews Miss the Real Product Debt
The problem with most mid-year planning cycles is that they optimize for narrative, not truth. PMs walk into H2 planning with adoption dashboards that show growth in user count, query volume, or API calls. Leadership sees a line going up and approves the next phase. But volume is not value. A data product that generates 10,000 queries per week but changes zero decisions is technical debt with good engagement metrics.
According to McKinsey’s 2024 State of AI Report, 61% of organizations report that their data infrastructure investments have not translated into measurable business outcomes. The issue is not a lack of data—it’s a lack of feedback loops. Most data products ship without instrumentation to measure whether anyone trusts the output, whether the output aligns with the business question it was designed to answer, or whether the underlying data contracts are holding up under real-world use.
A mid-year review that does not audit product health is a planning exercise built on assumptions. The Q2 Health Check forces you to verify those assumptions before you commit to H2 scope. If your data contracts are breaking weekly, your SLAs are unmet 40% of the time, and your consumers rate trustworthiness at 2 out of 5, you do not need new features—you need to fix the foundation. Leadership alignment on skill prioritization matters here: if your organization treats technical rigor as a “hard skill” that engineers own and stakeholder communication as a “soft skill” that PMs manage, you will struggle to execute a health check framework across cross-functional teams. The diagnostic requires both.
The Q2 Product Integrity Diagnostic: A Five-Dimension Health Check
This is a five-step process. Each step evaluates one dimension of product health and produces a red/yellow/green score. Red means the product has foundational issues that will block future work. Yellow means the product is functional but fragile. Green means the product is production-stable and ready for iteration. The entire diagnostic takes four hours if you have instrumentation in place. If you do not, that is your first red flag.
Step 1: Data Contract Integrity Audit
A data contract defines the schema, format, data types, and expected freshness of every dataset your product consumes or produces. The audit question is simple: how many times in the past 90 days did an upstream schema change break your product without warning? If the answer is “I don’t know,” you do not have contracts—you have informal agreements that fail silently. If the answer is more than zero, your contracts are not enforced.
Run a query against your data lineage tool or orchestration logs. Count schema drift incidents, null value spikes, and late-arriving data events. A green score means zero unplanned schema changes in 90 days. Yellow means 1-2 incidents with documented mitigation. Red means 3 or more, or any incident that caused a user-facing outage. Most teams score red here and do not realize it until they look.
The surprising part of this step: the fix is not technical—it is organizational. Data contracts fail because there is no enforcement mechanism. If an upstream team can push a breaking change to production without notifying downstream consumers, the contract is ceremonial. The real work is establishing a change approval process and instrumenting your pipelines to reject non-conforming data at ingestion. That is a product manager conversation with data engineering leadership, not a JIRA ticket.
Step 2: SLA Adherence Scoring
If you publish a data product with a stated refresh cadence, latency threshold, or uptime guarantee, you have an SLA whether or not you call it that. Step two audits how often you actually met those commitments in Q2. Most teams skip this step because they assume “if nobody complained, we’re fine.” That assumption is wrong. According to Forrester’s 2024 data quality research, 68% of business users stop using a data product after encountering a single trust issue—but only 22% report the issue to the product team.
Pull your observability metrics. For each SLA you committed to, calculate the percentage of time you met it in Q2. A green score is 98% or higher. Yellow is 90-97%. Red is anything below 90%. If you do not have observability metrics, you score red by default. The hardest part of this step is not the math—it is admitting that you made commitments you cannot measure.
David Ohnstad ran this audit on a federated data product serving three business units. The stated SLA was “daily refresh by 8 AM Central.” The actual performance was 73% on-time over 90 days. Nobody had flagged it because the delays were inconsistent—some days it was 8:07 AM, some days 10:15 AM, and twice it did not refresh until the following afternoon. Users had learned to check timestamps before trusting the data, which meant the product had become a source of friction, not insight. The fix required renegotiating the SLA to match what the pipeline could reliably deliver, then instrumenting alerts to catch violations before users noticed. For more on the organizational challenges of federated data architecture product management, where SLA accountability is distributed across teams, see the earlier breakdown of ownership without authority.
Step 3: Consumer Satisfaction Survey
This is the step most PMs resist because it exposes uncomfortable truths. Send a three-question survey to every active user of your data product. Active means anyone who queried, opened, or consumed the product at least once in the past 30 days. The questions are:
1. On a scale of 1-5, how much do you trust the data in this product?
2. On a scale of 1-5, how often does this product help you make a better decision?
3. What would you change about this product if you could change one thing?
A green score is an average of 4.0 or higher on both quantitative questions. Yellow is 3.0-3.9. Red is anything below 3.0. The qualitative responses tell you what to fix first. If 60% of respondents ask for the same feature, that is a roadmap signal. If 60% of respondents say “I don’t understand what this data means,” that is a documentation and onboarding failure.
The surprising insight here: trust scores predict sustained usage better than adoption metrics. A product with 200 users and a 4.2 trust score will outlive a product with 2,000 users and a 2.8 trust score. The math is simple—untrusted data products get deprecated the moment budget pressure appears. Trusted products survive cuts because someone will fight to keep them funded.
Step 4: Lineage Documentation Completeness
Data lineage is the map that shows where your data comes from, how it is transformed, and where it flows. Lineage documentation is the artifact that lets a new PM, analyst, or auditor understand that map without asking you. This step audits whether your lineage documentation is complete, current, and accessible. The test is operational: if a new analyst joined your team today, could they trace a data quality issue back to its source system without asking anyone?
Score this as a percentage. For every table, view, or dataset your product exposes, ask: Is the source system documented? Are the transformations documented? Is the refresh schedule documented? Is the owner documented? Green is 95-100% completeness. Yellow is 75-94%. Red is below 75%. If you do not have a lineage tool, you can still score this manually by auditing your data catalog, README files, or Confluence pages.
The counterintuitive part: lineage documentation is not a nice-to-have for compliance—it is the earliest warning system for product decay. When documentation falls out of sync with reality, it means someone made a change without updating the system of record. That is the same cultural failure that causes schema drift and SLA violations. Incomplete lineage is a symptom of a team that ships features faster than it can maintain them.
Step 5: Incident Frequency and Mean Time to Resolution
Count every incident in Q2 where your data product was unavailable, incorrect, or delivered late enough to miss a business deadline. Include incidents you caught before users did. For each incident, calculate mean time to resolution (MTTR)—the hours between “something broke” and “it is fixed and verified.” A green score is zero user-impacting incidents in 90 days, or an MTTR under 2 hours for any incidents that occurred. Yellow is 1-3 incidents with MTTR under 8 hours. Red is 4 or more incidents, or any incident with MTTR over 24 hours.
Most teams score yellow here. The fix is not better engineering—it is better instrumentation. If your first signal of an incident is a Slack message from a user, your monitoring is broken. The product should detect and alert on failures before humans notice. That requires query-level observability, automated data quality checks, and escalation workflows. These are table stakes for a production data product, but according to Gartner’s 2024 data infrastructure survey, only 34% of data teams have automated observability in place.
What the Red Scores Mean for H2 Planning
If you score red on two or more dimensions, stop planning new features. You do not have a roadmap problem—you have a foundation problem. A data product with broken contracts, missed SLAs, and low trust scores cannot support new capabilities. Every feature you add increases complexity without increasing reliability. The result is a product that works less often, for fewer people, at higher cost.
The hard truth is that most mid-year planning decks ignore this. PMs walk into H2 with a slide that says “increase user adoption by 40%” without acknowledging that current users trust the product at 2.7 out of 5. Leadership approves the plan because the narrative sounds strategic. Six months later, adoption has not moved and the PM is explaining why in a performance review.
David Ohnstad has seen this pattern four times. The most recent case was a data product supporting a pricing analytics team. Q2 planning proposed three new features: competitive benchmarking, predictive margin analysis, and a mobile-friendly dashboard. The health check revealed red scores on contract integrity (6 schema breaks in 90 days), SLA adherence (81% on-time), and consumer satisfaction (2.9 trust score). The product was functional but fragile. Adding features would have made it worse.
The decision was to freeze the roadmap for eight weeks and fix the foundation. Data contracts were formalized and enforced with schema validation at ingestion. SLAs were renegotiated to match pipeline reality, and observability was instrumented to alert before users noticed failures. Consumer satisfaction was re-surveyed at the end of Q3. Trust scores rose to 4.1. Adoption grew 23% without shipping a single new feature. The lesson: a stable product attracts users. A fragile product repels them, no matter how many features you add.
If you are evaluating whether to invest in new AI capabilities, this diagnostic applies there too. David Ohnstad on AI and enterprise SaaS has written extensively on this: data PMs should audit whether their existing ML model performance and inference infrastructure can handle incremental improvements before investing in new AI capabilities. A red score on lineage or incident frequency is a signal that your infrastructure cannot reliably support what you already built, let alone what you are planning.
The Contrarian Position: Stop Measuring Adoption, Start Measuring Decision Velocity
Most data product roadmaps optimize for adoption metrics—monthly active users, query volume, dashboard views. These numbers are easy to measure and easy to show in planning decks. They are also the wrong proxy for value. A data product that is opened daily but never changes a decision is a reporting tool, not a decision-support system. The business does not need more reports. It needs faster, better decisions.
Decision velocity is the time between “I have a question” and “I have enough trusted data to act.” The best data products collapse that time from days to minutes. The worst data products extend it by introducing new questions: Is this data current? Can I trust this number? What does this metric actually measure? If your product increases decision latency instead of reducing it, you are building technical debt with a Tableau license.
The Q2 Health Check reorients planning around decision velocity. A red score on trust means your product is slowing decisions, not accelerating them. A red score on SLA adherence means users cannot rely on your product when they need it. A red score on lineage means users spend cognitive energy validating your data instead of using it. These failures compound. A product that scores red on three dimensions might have 10,000 users, but those users are working around the product, not with it.
This position is not popular with leadership teams that want to see growth metrics in every planning deck. But David Ohnstad Minnesota-based work with enterprise SaaS platforms has proven it repeatedly: the fastest way to grow adoption is to make the product trustworthy first and feature-rich second. Users do not stay because you launched a new feature. They stay because the product works when they need it.
How to Run the Health Check in Four Hours
Block four hours in the final week of Q2. Invite your lead data engineer and your most active product consumer. You need three perspectives: the PM who owns the roadmap, the engineer who knows where the pipelines break, and the user who knows whether the product actually solves their problem. The goal is not consensus—it is calibration. You are aligning on what “red” means before you score anything.
Spend the first hour on data contract integrity. Pull your orchestration logs, lineage tool, or schema registry. Count breaking changes. If you do not have logs, that is your red score. Document it and move on. Spend the second hour on SLAs and incidents. Calculate adherence percentages and MTTR. If you discover you never defined SLAs, write them now—even if they are aspirational. The act of writing them surfaces what you have been avoiding.
Spend the third hour on the consumer satisfaction survey. Draft it, send it, and move to lineage while you wait for responses. Audit your documentation against your actual data assets. For every gap, document it. Do not try to fix it in this session—you are diagnosing, not remediating. Spend the final hour reviewing survey responses and synthesizing your scores. Create a one-page summary with five scores (red/yellow/green for each dimension) and three prioritized fixes.
The output is not a planning deck. It is a decision artifact. If you score green across all five dimensions, you have permission to plan ambitious H2 features. If you score yellow on two or more, your H2 plan should allocate 40% of capacity to foundation work. If you score red on two or more, freeze feature work and fix the product. This is not a suggestion—it is risk management. A fragile product does not survive budget cuts. A stable product does.
When the Health Check Reveals Organizational Gaps, Not Product Gaps
Sometimes the health check surfaces failures that PMs cannot fix alone. A red score on data contracts might reveal that your organization has no formal change management process for shared datasets. A red score on SLAs might reveal that upstream teams do not recognize downstream dependencies. A red score on consumer satisfaction might reveal that users were never trained on how to interpret the data. These are not product problems—they are organizational design problems.
The health check does not solve these problems, but it makes them visible before H2 planning begins. That is the real value. Most PMs enter mid-year planning defending why their product did not meet adoption targets without naming the dependencies they do not control. The health check gives you a structured way to say: “We cannot improve trust scores until upstream teams enforce schema contracts. That is not on our roadmap—it is an organizational capability we need leadership to prioritize.”
This is where data product manager federated architecture challenges become acute. In a centralized data org, the PM can escalate contract enforcement to a shared platform team. In a federated model, you are negotiating with peer teams who have competing priorities. The health check quantifies the cost of that negotiation failure: six schema breaks, 81% SLA adherence, and a 2.9 trust score. Leadership can choose to ignore that, but they cannot claim they were not warned.
What is a data product health check framework?
A data product health check framework is a quarterly diagnostic process that evaluates whether a data product is production-stable and trusted by its users. It assesses five dimensions—data contract integrity, SLA adherence, consumer satisfaction, lineage documentation, and incident frequency—and produces a red/yellow/green score for each. The output identifies foundational issues that planning cycles often ignore, allowing PMs to prioritize stability over new features when necessary.
How do you measure data product trust?
Data product trust is measured by surveying active users with two questions: “On a scale of 1-5, how much do you trust the data?” and “How often does this product help you make a better decision?” A trust score of 4.0 or higher predicts sustained usage. Scores below 3.0 indicate the product is fragile and at risk of being deprecated during budget reviews, regardless of adoption metrics.
Why do mid-year planning reviews miss product health issues?
Mid-year planning reviews optimize for narrative and growth metrics—user count, query volume, feature velocity—without auditing whether the underlying product is stable or trusted. Most teams enter H2 planning without knowing their SLA adherence percentage, schema break frequency, or consumer trust scores. This creates roadmaps built on assumptions that fail under production load, leading to abandoned features and missed adoption targets.
The Two Takeaways Leadership Needs and the One Question PMs Should Answer First
For practitioners: run the health check in the final week of Q2 before you finalize your H2 roadmap. If you score red on two or more dimensions, freeze feature work and fix the foundation. A fragile product does not get better with more features—it gets worse. Stability compounds. Fragility does too.
For leaders: if your PMs cannot answer basic questions about SLA adherence, contract integrity, or consumer trust, your mid-year planning decks are speculative fiction. The Q2 Health Check is a forcing function that surfaces the gaps before you commit H2 budget. A four-hour diagnostic is cheaper than six months of roadmap work that ships to users who have already stopped trusting the product.
The question PMs should answer first: when did you last verify that your data product is changing decisions, not just generating reports? If the answer is “I assume it is because people use it,” you are measuring activity, not impact. Run the health check. The results will tell you whether your H2 plan should focus on building new capabilities or repairing the ones you already shipped.
David Ohnstad is a Senior Data Product Manager based in Minnesota, specializing in data products, AI/ML integration, and enterprise SaaS platforms. Follow his work at github.com/davidohnstad40-netizen.
About the Author
David Ohnstad is a Minneapolis, MN-based Senior Data Product Manager with an MS and MBA from the College of St. Scholastica. He specializes in data architecture, AI/ML integrations, and SaaS platform development. Outside work, he builds furniture and explores the Minnesota outdoors. Find his work at davidohnstad.com and github.com/davidohnstad40-netizen.