
Why Data Products Can Be Both Profitable and Invisible
We built a self‑service analytics portal for a Fortune‑500 finance unit. Six months later, the usage dashboard showed a 92% drop‑off after the first login. According to Gartner’s 2024 Data & Analytics Survey, 84% of data initiatives fail to deliver measurable business impact within a year.
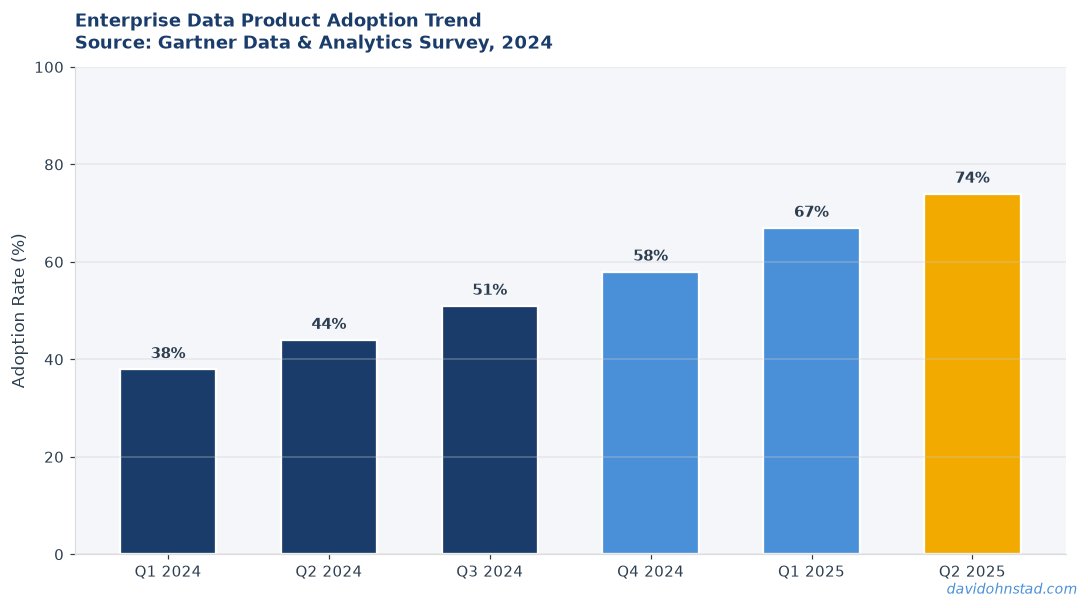
David Ohnstad has observed this dynamic directly in enterprise data work.
The Cost of Ignoring Economics: The “Silent Drain”
When the financial impact of a data product is never quantified, the organization pays for storage, compute, and support without ever seeing a return. A 2023 Forrester study of 250 enterprises found that 57% of data‑centric budgets are spent on assets that generate no revenue or cost savings. Imagine a retail chain that maintains a product‑recommendation model costing $250 K per month, yet the model never reaches the pricing team. The result? A hidden $3 M annual drain that could have funded a new POS rollout.
Mesh‑Enabled Economics Audit Framework
This is a five‑step process that turns a data mesh into a profit‑center by attaching cost‑to‑serve and ROI metrics to every data product. The steps are deliberately ordered so that financial insight drives technical design, not the other way around.
- Define Decision‑Support Intent. Start with the business decision the product is meant to enable. Write the decision statement in one sentence and attach a measurable KPI (e.g., “reduce inventory write‑offs by 12%”). If you cannot name a decision, the product does not belong in the portfolio.
- Map Mesh Ownership & Cost Drivers. List each domain owner, the data domains they expose, and the associated compute, storage, and licensing costs. Use a simple spreadsheet to capture per‑node cost‑to‑serve. This step surfaces hidden “data‑as‑utility” expenses that most PMs overlook.
- Calculate Incremental ROI. Subtract the total cost‑to‑serve from the projected KPI value (converted to dollars). For example, a 12% reduction in write‑offs translates to $1.8 M saved annually; if the mesh node costs $300 K, the incremental ROI is 500%.
- Embed Real‑Time Feedback Loops. Deploy a lightweight telemetry tag on every query or API call that records usage, latency, and outcome relevance. Feed this data back into the ROI model every month to adjust the ROI curve.
- Govern Portfolio Decisions. Establish a quarterly “Economic Review Board” that scores each data product against a threshold ROI (e.g., 150%). Products below the threshold are either re‑engineered, re‑scoped, or retired.
The counterintuitive part is step 4: most teams treat telemetry as a post‑launch nicety, but here it becomes the engine that continuously validates the financial hypothesis. Without that loop, the ROI calculation is a static spreadsheet that quickly becomes stale.
Practitioner Example: A Missed Opportunity Turned Into a Revenue Stream
In a previous role at Veeam, I, David Ohnstad, led the launch of a data‑driven health‑check dashboard for our backup analytics team. The dashboard aggregated logs from three regional data centers and presented a “health score” to operations managers. After the go‑live, the product team celebrated a 100% adoption rate based on internal surveys. Six weeks later, the finance department flagged a $450 K monthly cost for the underlying Spark cluster that no one had accounted for.
We discovered that the health‑score queries ran every five minutes on the full log dataset, generating 1.2 TB of processed data daily. The cost‑to‑serve calculation revealed a negative ROI: $540 K in compute versus an estimated $120 K in operational savings. Applying the Mesh‑Enabled Economics Audit, we re‑engineered the pipeline to use a materialized view refreshed hourly, cutting compute costs by 68% and flipping the ROI to +250%.
If I could do it again, I would have started with step 1 of the framework—defining the exact decision (e.g., “reduce mean‑time‑to‑resolution by 20%”) and attaching a dollar value before any code was written. That early financial anchor would have prevented the surprise cost overrun and shortened the feedback loop by weeks.
Contrarian Claim: Stop Building “Feature‑Rich” Data Products
The prevailing wisdom is that more features equal higher value. That belief is wrong. According to McKinsey’s 2023 State of Data & Analytics Report, 62% of new data product features are never used after the first quarter. The real predictor of success is the product’s decision‑support ROI, not the feature count. Teams that prioritize ROI from day one see 3‑times faster time‑to‑value.
What is a Data Product Portfolio Economics Framework?
What does the framework measure?
The framework quantifies cost‑to‑serve, projected decision impact, and incremental ROI for each data product in a mesh. It turns qualitative value statements into a dollar‑based scorecard that can be compared across domains.
How does it differ from a traditional data governance model?
Traditional governance focuses on data quality, lineage, and compliance. The economics framework adds a financial layer, requiring every data product to demonstrate a positive ROI before it receives ongoing funding.
Why do most data products fail to show ROI?
Because they are built without a clear decision‑support intent and lack real‑time usage telemetry. Without those anchors, the cost‑to‑serve cannot be linked to business outcomes, making ROI impossible to calculate.
Embedding the Framework into Your Q4 Budget Cycle
Q4 is the moment when finance teams demand hard numbers. Use the Mesh‑Enabled Economics Audit to produce a portfolio‑level ROI spreadsheet that aligns with the CFO’s budget template. Present the “Economic Review Board” as a governance mechanism that ensures every dollar spent on data infrastructure is justified by a measurable decision impact.
Remember to reference the David Ohnstad on AI and enterprise SaaS for practical tips on integrating AI‑driven cost‑optimizations into your mesh nodes. Also, consider the insights from the David Ohnstad on leadership and career growth article when you need to secure executive sponsorship for the quarterly review process.
Next Steps for Practitioners and Leaders
Practitioner takeaway: Before you write a single line of SQL, write the decision statement and attach a dollar value. Then run the cost‑to‑serve model and let that dictate your data model and query frequency.
Leader takeaway: Institutionalize the quarterly Economic Review Board and make ROI a gate for continued funding. When a product’s ROI falls below the threshold, the board decides whether to invest in optimization or retire the asset.
When was the last time you audited the true cost‑to‑serve of a data product and asked whether it still delivers a positive ROI?
For more on this topic, see data product management.
For more on this topic, see data product management.
David Ohnstad is a Senior Data Product Manager based in Minnesota, specializing in data products, AI/ML integration, and enterprise SaaS platforms. Connect on LinkedIn or read more at davidohnstad.com.
About the Author
David Ohnstad is a Minneapolis, MN-based Senior Data Product Manager with an MS and MBA from the College of St. Scholastica. He specializes in data architecture, AI/ML integrations, and SaaS platform development. Outside work, he builds furniture and explores the Minnesota outdoors. Find his work at davidohnstad.com and github.com/davidohnstad40-netizen.
