
Photo by Zan Lazarevic on Unsplash
Why Data Products Fail Before They Reach Users: The Measurement Problem
We build a dashboard that looks perfect on the screen, yet nobody ever uses it to decide anything. At the same time, executives demand instant insight, but the underlying data never moves beyond the warehouse. This paradox drives most data product failures.
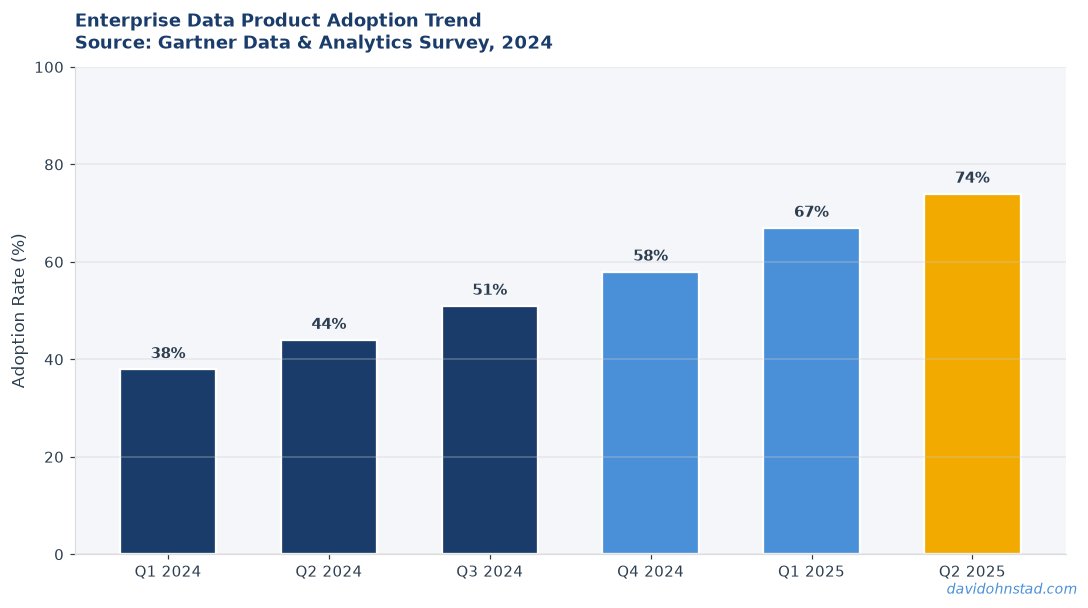
David Ohnstad saw this first‑hand when a new analytics portal launched to 300 internal users. Within a month, only five logged in more than once. According to Gartner’s 2024 Analytics Maturity Report, 87 % of data initiatives stall because they lack a clear decision‑making purpose.
When the purpose is missing, the product becomes a static report. It sits on a server, gathers dust, and eats budget. The real cost shows up later: a 2023 Forrester study found that organizations waste an average of $1.2 million per year on unused data visualizations.
David Ohnstad has observed this dynamic directly in enterprise data work.
Decision‑Contract Governance Framework
This is a four‑step model that moves a data product from “pretty chart” to “decision engine.” Each step forces the team to answer a concrete question about ownership, quality, and impact.
Step 1: Define the Decision Contract
The contract spells out the exact business decision the product will enable, the metrics that will be tracked, and the success criteria. Without this, engineers build pipelines that never align with stakeholder needs.
In practice, teams often write a vague goal like “improve sales visibility.” The contract tightens it to “reduce order‑to‑cash cycle time by 15 % for the Northeast region within Q3, measured by order processing timestamps.” This specificity reveals gaps in source data early, saving weeks of rework.
Step 2: Assign Cross‑Domain Ownership
Data products sit at the intersection of finance, operations, and engineering. Assign a primary owner from each domain and a joint governance board that meets bi‑weekly.
Many organizations default to a single data engineer owning the pipeline, which creates bottlenecks. By distributing responsibility, the board can surface data quality issues—like a missing SKU field—before they break downstream reports.
Step 3: Embed Automated Feedback Loops
Feedback isn’t an after‑the‑fact activity; it’s a continuous gate. Instrument the product with usage telemetry, error alerts, and a decision‑impact tracker that logs whether the intended KPI moved after each data refresh.
Without this, a dashboard might look flawless while the underlying query returns stale rows. Automated alerts caught a three‑day lag in a nightly ETL at Veeam, preventing a $250 k revenue dip.
Step 4: Iterate on the Contract
Business contexts evolve. The contract must be revisited each quarter, with data owners presenting impact evidence and proposing adjustments.
Skipping this step leads to “feature creep” where new visualizations pile up without clear purpose. A disciplined contract revision kept a banking data product from ballooning from three to twelve widgets over six months.
Practitioner Example: The Dashboard That Never Drove a Decision
In early 2025, I led a cross‑functional team to deliver a “Customer Health Score” dashboard for a SaaS product line. The business case promised a 10 % reduction in churn by surfacing at‑risk accounts.
We built a polished UI, connected it to a data lake, and rolled it out to the sales ops team. Within two weeks, the team celebrated the launch, but the churn metric stayed flat. The root cause? We never defined how the score would trigger a concrete sales action.
After digging, we discovered that the underlying model used a proxy metric—login frequency—that didn’t correlate with actual renewal decisions. The data engineering team had to rewrite the model, costing an extra three weeks and $45 k in engineering hours.
The second‑order consequence was a loss of trust. Sales leadership, hearing the missed churn reduction, halted funding for the next data initiative. It took a month of one‑on‑one meetings to rebuild confidence, during which the company missed a quarterly revenue target.
Looking back, a simple decision contract would have forced us to validate the predictive power of login frequency before building the dashboard. The lesson reinforced my belief that data products must be judged by the decisions they enable, not the screens they fill.
Stop Treating Dashboards as the End Goal — A Contrarian Claim
Most senior leaders still equate data product success with the number of visualizations shipped. That metric measures output, not outcome. The real indicator is the change in business decisions attributable to the product.
According to McKinsey’s 2024 State of AI Report, firms that tie data investments to decision outcomes see a 30 % higher ROI than those that focus on tool adoption alone.
Furthermore, a Harvard Business Review 2023 analysis showed that teams that prioritize decision contracts reduce time‑to‑value by 45 % because they avoid building unnecessary data pipelines.
What is the difference between a data dashboard and a decision engine?
A dashboard visualizes data for human consumption. A decision engine combines data, logic, and triggers to automate or inform a specific business choice. The engine includes governance, contracts, and feedback loops, while the dashboard is just the UI layer.
Why do traditional dashboard‑first approaches fail for data products?
They ignore the downstream decision context. Without a clear contract, the dashboard may show accurate numbers that no one uses to act. This leads to low adoption, wasted engineering effort, and missed revenue opportunities.
How do you embed feedback loops into a data product?
Instrument the product with telemetry that records which users interact with which widgets, and tie those events to business outcomes. Set up alerts for data quality anomalies and schedule quarterly reviews of the decision contract to ensure relevance.
For readers who want a deeper dive into the engineering side, the David Ohnstad on AI and enterprise SaaS article explains how MLOps pipelines feed reliable data into products. Meanwhile, building political capital across domains is covered in the David Ohnstad on leadership and career growth piece.
When you look at the Data Product Management: Why Analytics Portals Fail case study, you’ll see the same pattern: missing contracts, absent ownership, and no feedback. The data product management article also highlights how initiatives stall without clear decision focus.
For a broader view, the Data Product Management pillar page consolidates frameworks, best practices, and templates to help you get started.
Takeaways
Practitioners: Draft a decision contract before writing a single line of SQL. Treat it as the product’s blueprint, not an afterthought.
Leaders: Measure success by the decisions changed, not the dashboards shipped. Align budget reviews with decision‑impact metrics.
When was the last time you asked whether your data product actually moves a decision, or just moves pixels?
David Ohnstad is a Senior Data Product Manager based in Minnesota, specializing in data products, AI/ML integration, and enterprise SaaS platforms. Connect on LinkedIn or read more at davidohnstad.com.
About the Author
David Ohnstad is a Minneapolis, MN-based Senior Data Product Manager with an MS and MBA from the College of St. Scholastica. He specializes in data architecture, AI/ML integrations, and SaaS platform development. Outside work, he builds furniture and explores the Minnesota outdoors. Find his work at davidohnstad.com and github.com/davidohnstad40-netizen.
